Visual Reasoning Benchmark
The Reasoning task asks each model questions that require thinking beyond simply reading or spotting something. It covers arithmetic, comparisons, spatial relationships, logical deduction, and multi-step inference that combines several visual facts. The answer is never written directly in the image; the model must interpret the scene and reason about it.
Evals updated October 13, 2026Pricing updated October 15, 2026
| 1 | high | 91.4% ±0.7, Mean of 3 runs, range 90.7 to 92.0 | 91.4%±0.7, Mean of 3 runs, range 90.7 to 92.0 | 2.2K | $0.013 | 12.95s | ||
| 2 | high | 91.2% ±0.3, Mean of 3 runs, range 90.7 to 91.4 | 89.6%±1.0, Mean of 3 runs, range 88.7 to 90.7 | 1.4K | $0.021 | 5.51s | ||
| 3 | low | 89.4% ±1.3, Mean of 3 runs, range 88.1 to 90.7 | 89.8%±1.0, Mean of 3 runs, range 88.7 to 90.7 | 1.2K | $0.0024 | 11.97s | ||
| 4 | high | 88.7% ±2.0, Mean of 3 runs, range 87.4 to 91.4 | 87.0%±2.6, Mean of 3 runs, range 84.8 to 90.1 | 1.4K | $0.0042 | 8.91s | ||
| 5 | low | 87.2% ±1.0, Mean of 3 runs, range 86.1 to 88.1 | 84.5%±1.3, Mean of 3 runs, range 83.4 to 86.1 | 1.3K | $0.016 | 3.91s | ||
| 6 | high | 85.9% ±2.6, Mean of 3 runs, range 82.8 to 88.1 | 85.9%±2.6, Mean of 3 runs, range 82.8 to 88.1 | 1.7K | $0.011 | 9.12s | ||
| 7 | Muse WonderNEW | low | 85.2% ±0.3, Mean of 3 runs, range 84.8 to 85.4 | 85.2%±0.3, Mean of 3 runs, range 84.8 to 85.4 | 2.3K | $0.024 | 10.78s | |
| 8 | high | 84.5% ±1.0, Mean of 3 runs, range 83.4 to 85.4 | 84.5%±1.0, Mean of 3 runs, range 83.4 to 85.4 | 6.5K | $0.021 | 21.81s | ||
| 9 | high | 83.9% ±1.7, Mean of 3 runs, range 82.1 to 85.4 | 72.8%±1.0, Mean of 3 runs, range 72.2 to 74.2 | 1.7K | $0.0061 | 7.47s | ||
| 10 | low | 83.7% ±1.3, Mean of 3 runs, range 82.1 to 84.8 | 82.6%±1.7, Mean of 3 runs, range 80.8 to 84.1 | 1.4K | $0.0033 | 11.65s | ||
| 11 | Muse WonderNEW | high | 83.4% ±0.7, Mean of 3 runs, range 82.8 to 84.1 | 83.4%±0.7, Mean of 3 runs, range 82.8 to 84.1 | 3.4K | $0.047 | 21.70s | |
| 12 | low | 83.0% ±1.0, Mean of 3 runs, range 82.1 to 84.1 | 74.8%±1.3, Mean of 3 runs, range 73.5 to 76.2 | 1.6K | $0.0090 | 11.05s | ||
| 13 | low | 82.1% ±2.0, Mean of 3 runs, range 80.1 to 84.1 | 81.0%±2.3, Mean of 3 runs, range 78.8 to 83.4 | 1.9K | $0.0082 | 14.27s | ||
| 14 | high | 81.9% ±1.3, Mean of 3 runs, range 80.1 to 82.8 | 81.2%±2.0, Mean of 3 runs, range 78.8 to 82.8 | 2.3K | $0.0050 | 9.81s | ||
| 15 | low | 81.2% ±0.3, Mean of 3 runs, range 80.8 to 81.5 | 81.0%±0.3, Mean of 3 runs, range 80.8 to 81.5 | 1.8K | $0.0034 | 8.98s | ||
| 16 | high | 81.0% ±1.7, Mean of 3 runs, range 79.5 to 82.8 | 80.3%±2.0, Mean of 3 runs, range 78.8 to 82.8 | 2.9K | $0.018 | 11.81s | ||
| 16 | high | 81.0% ±2.0, Mean of 3 runs, range 79.5 to 83.4 | 81.0%±2.0, Mean of 3 runs, range 79.5 to 83.4 | 3.3K | $0.0091 | 14.69s | ||
| 18 | low | 80.8% ±2.0, Mean of 3 runs, range 78.8 to 82.8 | 80.8%±2.0, Mean of 3 runs, range 78.8 to 82.8 | 1.5K | $0.0022 | 14.71s | ||
| 19 | high | 80.3% ±2.0, Mean of 3 runs, range 78.2 to 82.1 | 79.7%±2.0, Mean of 3 runs, range 77.5 to 81.5 | 2.5K | $0.011 | 31.92s | ||
| 20 | high | 77.7% ±1.0, Mean of 3 runs, range 76.8 to 78.8 | 77.3%±1.0, Mean of 3 runs, range 76.2 to 78.2 | 1.6K | $0.0061 | 7.37s | ||
| 20 | low | 77.7% ±2.0, Mean of 3 runs, range 76.2 to 80.1 | 77.7%±2.0, Mean of 3 runs, range 76.2 to 80.1 | 1.7K | $0.0031 | 14.28s | ||
| 22 | high | 76.6% ±1.3, Mean of 3 runs, range 75.5 to 78.2 | 74.8%±1.0, Mean of 3 runs, range 73.5 to 75.5 | 4.1K | $0.013 | 16.63s | ||
| 23 | low | 76.4% ±0.7, Mean of 3 runs, range 75.5 to 76.8 | 11.9%±0.0, Mean of 3 runs, range 11.9 to 11.9 | 1.6K | $0.0049 | 10.22s | ||
| 24 | low | 75.9% ±2.0, Mean of 3 runs, range 73.5 to 77.5 | 75.9%±2.0, Mean of 3 runs, range 73.5 to 77.5 | 1.5K | $0.0048 | 11.30s | ||
| 25 | high | 75.7% ±0.3, Mean of 3 runs, range 75.5 to 76.2 | 74.6%±0.3, Mean of 3 runs, range 74.2 to 74.8 | 3.9K | $0.012 | 19.37s | ||
| 26 | low | 75.1% ±0.3, Mean of 3 runs, range 74.8 to 75.5 | 74.0%±0.3, Mean of 3 runs, range 73.5 to 74.2 | 2.7K | $0.0073 | 10.14s | ||
| 27 | high | 74.8% ±2.6, Mean of 3 runs, range 72.2 to 77.5 | 72.8%±2.3, Mean of 3 runs, range 70.2 to 74.8 | 2.3K | $0.0006 | 10.18s | ||
| 27 | high | 74.8% | 74.8% | 2.7K | $0.021 | 13.32s | ||
| 29 | high | 74.2% | 74.2% | 2.3K | $0.0040 | 6.41s | ||
| 29 | low | 74.2% ±1.7, Mean of 3 runs, range 72.2 to 75.5 | 72.2%±2.6, Mean of 3 runs, range 68.9 to 74.2 | 2.4K | $0.0061 | 7.35s | ||
| 29 | high | 74.2% | 67.5% | 1.8K | $0.018 | 8.59s | ||
| 29 | high | 74.2% | 74.2% | 3.6K | $0.033 | 79.92s | ||
| 33 | low | 73.3% ±1.0, Mean of 3 runs, range 72.2 to 74.2 | 73.3%±1.0, Mean of 3 runs, range 72.2 to 74.2 | 2.4K | $0.0064 | 25.27s | ||
| 34 | high | 73.1% ±2.0, Mean of 3 runs, range 71.5 to 75.5 | 36.2%±1.3, Mean of 3 runs, range 35.1 to 37.8 | 1.7K | $0.028 | 8.05s | ||
| 34 | high | 73.1% ±1.0, Mean of 3 runs, range 72.2 to 74.2 | 73.1%±1.0, Mean of 3 runs, range 72.2 to 74.2 | 3.8K | $0.012 | 44.44s | ||
| 36 | low | 72.6% ±3.6, Mean of 3 runs, range 69.5 to 76.8 | 72.6%±2.6, Mean of 3 runs, range 70.9 to 76.2 | 1.4K | $0.0037 | 8.44s | ||
| 37 | low | 72.2% | 72.2% | 1.9K | $0.012 | 9.27s | ||
| 37 | high | 72.2% ±3.6, Mean of 3 runs, range 68.9 to 76.2 | 72.2%±3.6, Mean of 3 runs, range 68.9 to 76.2 | 2.5K | $0.044 | 20.39s | ||
| 39 | low | 72.0% ±1.3, Mean of 3 runs, range 70.9 to 73.5 | 18.3%±0.7, Mean of 3 runs, range 17.9 to 19.2 | 1.5K | $0.019 | 5.94s | ||
| 40 | high | 71.7% ±1.3, Mean of 3 runs, range 70.2 to 72.8 | 71.7%±1.3, Mean of 3 runs, range 70.2 to 72.8 | 1.6K | $0.012 | 8.17s | ||
| 41 | low | 71.5% | 68.9% | 1.5K | $0.010 | 4.99s | ||
| 42 | high | 71.1% ±2.3, Mean of 3 runs, range 68.2 to 72.8 | 70.2%±2.6, Mean of 3 runs, range 66.9 to 72.2 | 1.9K | $0.0004 | 7.71s | ||
| 43 | low | 70.6% ±1.0, Mean of 3 runs, range 69.5 to 71.5 | 70.6%±1.0, Mean of 3 runs, range 69.5 to 71.5 | 1.6K | $0.015 | 6.80s | ||
| 44 | high | 69.5% ±0.7, Mean of 3 runs, range 68.9 to 70.2 | 69.5%±0.7, Mean of 3 runs, range 68.9 to 70.2 | 3.0K | $0.0011 | 23.61s | ||
| 45 | high | 68.9% | 68.9% | 2.7K | $0.0042 | 5.82s | ||
| 45 | low | 68.9% ±2.0, Mean of 3 runs, range 66.9 to 70.9 | 64.9%±0.7, Mean of 3 runs, range 64.2 to 65.6 | 1.9K | $0.0004 | 18.15s | ||
| 47 | high | 68.2% | 66.2% | 4.1K | $0.0043 | 58.41s | ||
| 48 | high | 66.9% ±1.3, Mean of 3 runs, range 65.6 to 68.2 | 66.7%±1.0, Mean of 3 runs, range 65.6 to 67.5 | 5.6K | $0.024 | 51.09s | ||
| 49 | low | 66.2% | 66.2% | 1.5K | $0.018 | 5.80s | ||
| 49 | high | 66.2% | 66.2% | 1.6K | $0.024 | 6.88s | ||
| 51 | low | 66.0% ±2.6, Mean of 3 runs, range 63.6 to 68.9 | 66.0%±2.6, Mean of 3 runs, range 63.6 to 68.9 | 1.5K | $0.0086 | 5.29s | ||
| 51 | high | 66.0% ±0.7, Mean of 3 runs, range 65.6 to 66.9 | 66.0%±0.7, Mean of 3 runs, range 65.6 to 66.9 | 3.9K | $0 | 42.86s | ||
| 53 | high | 65.6% ±3.6, Mean of 3 runs, range 60.9 to 68.2 | 65.6%±3.6, Mean of 3 runs, range 60.9 to 68.2 | 2.3K | $0.0015 | 12.33s | ||
| 54 | high | 65.3% ±1.0, Mean of 3 runs, range 64.2 to 66.2 | 65.3%±1.0, Mean of 3 runs, range 64.2 to 66.2 | 1.6K | $0.0067 | 6.32s | ||
| 55 | low | 64.9% | 64.9% | 1.6K | $0.0020 | 3.47s | ||
| 56 | low | 64.2% ±3.0, Mean of 3 runs, range 60.3 to 66.2 | 64.7%±3.6, Mean of 3 runs, range 60.3 to 67.5 | 1.5K | $0.0003 | 8.96s | ||
| 56 | low | 64.2% ±2.3, Mean of 3 runs, range 62.3 to 66.9 | 64.0%±2.6, Mean of 3 runs, range 61.6 to 66.9 | 4.0K | $0.015 | 26.03s | ||
| 58 | high | 64.0% ±1.3, Mean of 3 runs, range 62.9 to 65.6 | 64.0%±1.3, Mean of 3 runs, range 62.9 to 65.6 | 3.2K | $0.0096 | 13.47s | ||
| 59 | high | 63.8% ±2.0, Mean of 3 runs, range 62.3 to 66.2 | 63.8%±2.0, Mean of 3 runs, range 62.3 to 66.2 | 6.4K | $0.032 | 78.39s | ||
| 60 | high | 62.9% | 62.9% | 3.3K | $0.0026 | 25.13s | ||
| 61 | high | 62.3% | 62.3% | 1.3K | $0.011 | 9.30s | ||
| 62 | low | 62.0% ±2.0, Mean of 3 runs, range 60.3 to 64.2 | 62.0%±2.0, Mean of 3 runs, range 60.3 to 64.2 | 1.7K | $0 | 10.75s | ||
| 63 | high | 61.6% | 60.9% | 4.6K | $0.0005 | 59.29s | ||
| 63 | high | 61.6% | 61.6% | 5.1K | $0.011 | 62.64s | ||
| 65 | low | 61.1% ±1.3, Mean of 3 runs, range 59.6 to 62.3 | 61.1%±1.3, Mean of 3 runs, range 59.6 to 62.3 | 2.6K | $0.0093 | 17.18s | ||
| 66 | low | 60.9% ±2.0, Mean of 3 runs, range 59.6 to 63.6 | 60.9%±2.0, Mean of 3 runs, range 59.6 to 63.6 | 1.5K | $0.0051 | 5.77s | ||
| 67 | low | 60.5% ±5.0, Mean of 3 runs, range 55.0 to 64.9 | 60.3%±5.3, Mean of 3 runs, range 54.3 to 64.9 | 1.6K | $0.0006 | 5.65s | ||
| 68 | high | 59.8% ±2.6, Mean of 3 runs, range 57.0 to 62.3 | 59.8%±2.6, Mean of 3 runs, range 57.0 to 62.3 | 4.1K | $0.019 | 51.26s | ||
| 69 | high | 59.6% | 51.7% | 1.6K | $0.0002 | 5.38s | ||
| 70 | low | 59.2% ±1.7, Mean of 3 runs, range 57.6 to 60.9 | 58.7%±1.3, Mean of 3 runs, range 57.6 to 60.3 | 5.6K | $0 | 80.78s | ||
| 71 | Kimi K2.6 | high | 58.9% | 57.6% | 6.8K | $0.020 | 111.19s | |
| 72 | high | 58.5% ±1.3, Mean of 3 runs, range 57.0 to 59.6 | 55.9%±2.7, Mean of 3 runs, range 53.0 to 58.3 | 3.3K | $0.0008 | 36.78s | ||
| 73 | low | 58.1% ±2.3, Mean of 3 runs, range 55.6 to 60.3 | 58.1%±2.3, Mean of 3 runs, range 55.6 to 60.3 | 5.5K | $0 | 110.74s | ||
| 74 | low | 57.6% | 57.6% | 1.8K | $0.0009 | 6.55s | ||
| 74 | low | 57.6% ±1.7, Mean of 3 runs, range 55.6 to 58.9 | 57.6%±1.7, Mean of 3 runs, range 55.6 to 58.9 | 2.4K | $0.0082 | 22.53s | ||
| 74 | high | 57.6% ±2.0, Mean of 3 runs, range 55.6 to 59.6 | 57.4%±2.3, Mean of 3 runs, range 55.0 to 59.6 | 7.3K | $0.013 | 91.80s | ||
| 77 | low | 57.0% ±3.3, Mean of 3 runs, range 54.3 to 60.9 | 57.0%±3.3, Mean of 3 runs, range 54.3 to 60.9 | 1.6K | $0.0022 | 4.18s | ||
| 78 | high | 55.9% ±2.3, Mean of 3 runs, range 54.3 to 58.9 | 54.1%±3.3, Mean of 3 runs, range 51.0 to 57.6 | 3.5K | $0.0026 | 68.29s | ||
| 79 | low | 54.8% ±1.3, Mean of 3 runs, range 53.0 to 55.6 | 54.8%±1.3, Mean of 3 runs, range 53.0 to 55.6 | 6.7K | $0 | 53.56s | ||
| 80 | high | 54.3% | 46.4% | 5.2K | $0.014 | 139.35s | ||
| 81 | low | 54.1% ±0.3, Mean of 3 runs, range 53.6 to 54.3 | 53.9%±0.3, Mean of 3 runs, range 53.6 to 54.3 | 6.8K | $0 | 47.87s | ||
| 82 | low | 53.0% | 44.4% | 1.4K | $0.0078 | 3.00s | ||
| 83 | low | 52.8% ±1.3, Mean of 3 runs, range 51.7 to 54.3 | 52.1%±2.0, Mean of 3 runs, range 50.3 to 54.3 | 1.4K | $0 | 21.97s | ||
| 84 | high | 52.3% | 43.7% | 1.4K | $0.0078 | 2.45s | ||
| 85 | low | 51.0% | 42.4% | 1.5K | $0.0001 | 4.44s | ||
| 86 | high | 49.7% | 49.7% | 2.7K | $0.0069 | 29.02s | ||
| 87 | DeepSeek V4 Flash Vision Exp | high | 49.0% | 48.3% | 2.2K | $0.0025 | 16.40s | |
| 88 | low | 48.3% | 47.0% | 1.5K | $0.0012 | 2.38s | ||
| 89 | low | 47.7% ±2.0, Mean of 3 runs, range 45.0 to 49.0 | 47.7%±2.0, Mean of 3 runs, range 45.0 to 49.0 | 3.5K | $0 | 32.48s | ||
| 90 | low | 45.9% ±1.7, Mean of 3 runs, range 44.4 to 47.7 | 45.3%±1.3, Mean of 3 runs, range 44.4 to 47.0 | 8.2K | $0 | 66.01s | ||
| 91 | low | 43.0% | 43.0% | 1.4K | $0.0032 | 3.09s | ||
| 91 | high | 43.0% | 42.4% | 1.6K | $0.0043 | 4.12s | ||
| 93 | low | 42.4% | 41.7% | 403 | $0.0013 | 3.98s | ||
| 93 | low | 42.4% | 42.4% | 1.4K | $0.0008 | 4.51s | ||
| 95 | low | 41.5% ±1.0, Mean of 3 runs, range 40.4 to 42.4 | 40.6%±0.7, Mean of 3 runs, range 39.7 to 41.1 | 2.4K | $0 | 11.36s | ||
| 96 | low | 39.7% | 39.7% | 1.1K | $0.0003 | 2.19s | ||
| 97 | Kimi K2.6 | low | 39.1% | 24.5% | 1.5K | $0.0013 | 3.38s | |
| 98 | low | 38.9% ±0.3, Mean of 3 runs, range 38.4 to 39.1 | 38.0%±0.3, Mean of 3 runs, range 37.8 to 38.4 | 1.6K | $0.0013 | 3.27s | ||
| 99 | low | 38.6% ±2.3, Mean of 3 runs, range 35.8 to 40.4 | 38.0%±2.6, Mean of 3 runs, range 35.1 to 40.4 | 9.3K | $0 | 58.08s | ||
| 100 | low | 35.1% ±3.3, Mean of 3 runs, range 31.1 to 37.8 | 35.1%±3.3, Mean of 3 runs, range 31.1 to 37.8 | 1.1K | $0.0002 | 3.39s | ||
| 100 | low | 35.1% ±2.6, Mean of 3 runs, range 32.5 to 37.8 | 31.1%±3.3, Mean of 3 runs, range 28.5 to 35.1 | 1.1K | $0.0005 | 3.82s | ||
| 102 | low | 34.4% | – | 1.1K | $0 | 1.95s | ||
| 102 | low | 34.4% | 34.4% | 1.1K | <$0.0001 | 3.70s | ||
| 104 | high | 33.8% | 33.8% | 1.1K | $0.0002 | 1.96s | ||
| 105 | low | 33.1% ±2.3, Mean of 3 runs, range 30.5 to 35.1 | 33.1%±2.3, Mean of 3 runs, range 30.5 to 35.1 | 1.1K | $0 | 3.84s | ||
| 105 | low | 33.1% ±2.0, Mean of 3 runs, range 31.1 to 35.1 | 29.8%±0.0, Mean of 3 runs, range 29.8 to 29.8 | 1.1K | $0.0002 | 5.90s | ||
| 107 | low | 32.7% ±1.0, Mean of 3 runs, range 31.8 to 33.8 | 32.7%±1.0, Mean of 3 runs, range 31.8 to 33.8 | 1.0K | $0 | 5.25s | ||
| 108 | DeepSeek V4 Flash Vision Exp | low | 31.8% | 30.5% | 391 | $0.0002 | 1.23s | |
| 108 | low | 31.8% | 31.8% | 1.4K | $0.0017 | 3.77s | ||
| 110 | low | 29.8% | 29.8% | 1.1K | $0.0002 | 1.69s | ||
| 111 | low | 27.8% ±2.7, Mean of 3 runs, range 25.8 to 31.1 | 25.4%±2.6, Mean of 3 runs, range 22.5 to 27.8 | 1.1K | $0 | 0.69s | ||
| 112 | low | 27.1% ±1.3, Mean of 3 runs, range 25.8 to 28.5 | 26.3%±1.3, Mean of 3 runs, range 25.2 to 27.8 | 10.4K | $0 | 51.52s | ||
| 113 | low | 24.7% ±3.3, Mean of 3 runs, range 21.9 to 28.5 | 18.8%±3.0, Mean of 3 runs, range 15.9 to 21.9 | 1.1K | $0 | 0.37s |

LLM judge: a second model, Gemini 3.5 Flash, compared each answer with the ground truth and decided whether it is correct. Strict: the answer matched the ground truth exactly.
A ± after a score is half the range across that configuration's repeated runs; hover it for the run count and range. Scores without one are single runs. Every model is being re-run three times per task at each effort under the current protocol.
Score vs. cost
Reasoning score (Accuracy (LLM judge)) against estimated cost per sample, on a log scale. Upper-left is the sweet spot: high quality at low cost.
47 models on the current benchmark · Reasoning task only, low effort
Example Reasoning benchmark tasks
Real samples from the benchmark: the image each model sees, the question it is asked, and the ground-truth answer it is scored against.


The models are asked
If a worker wants to rearrange the five numbered pipes so that their labels are in strictly ascending order from top to bottom, what is the minimum number of pipes that must be moved? Answer with a single integer.
Ground truth
1
The models are asked
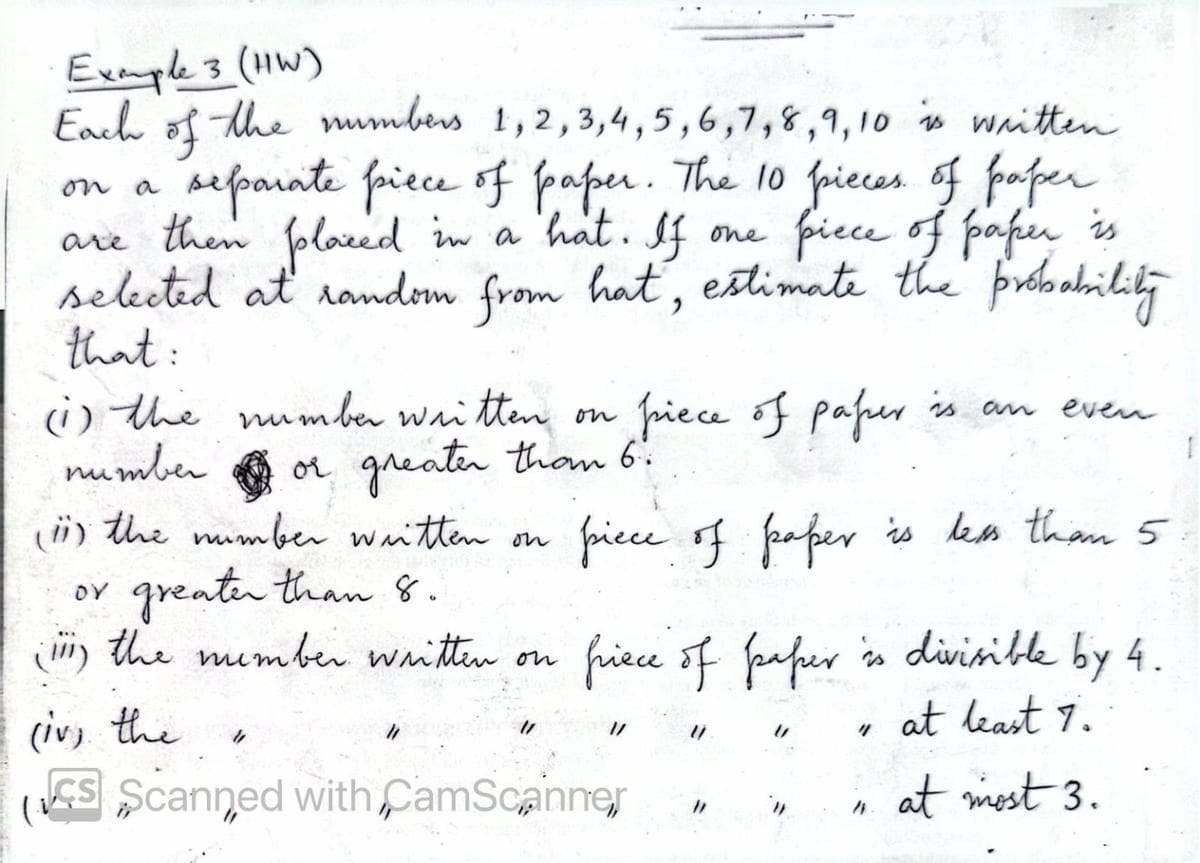
Given that the selected number satisfies condition (iii), what is the probability that it also satisfies condition (iv)? Choose one: 0, 1/4, 1/2, or 1.
Ground truth
1/2
The models are asked
Based on the technical drawing, what is the horizontal distance between the leftmost center of the left slot and the vertical centerline of the top hole? Answer with a number rounded to three decimal places.
Ground truth
2.742
The models are asked
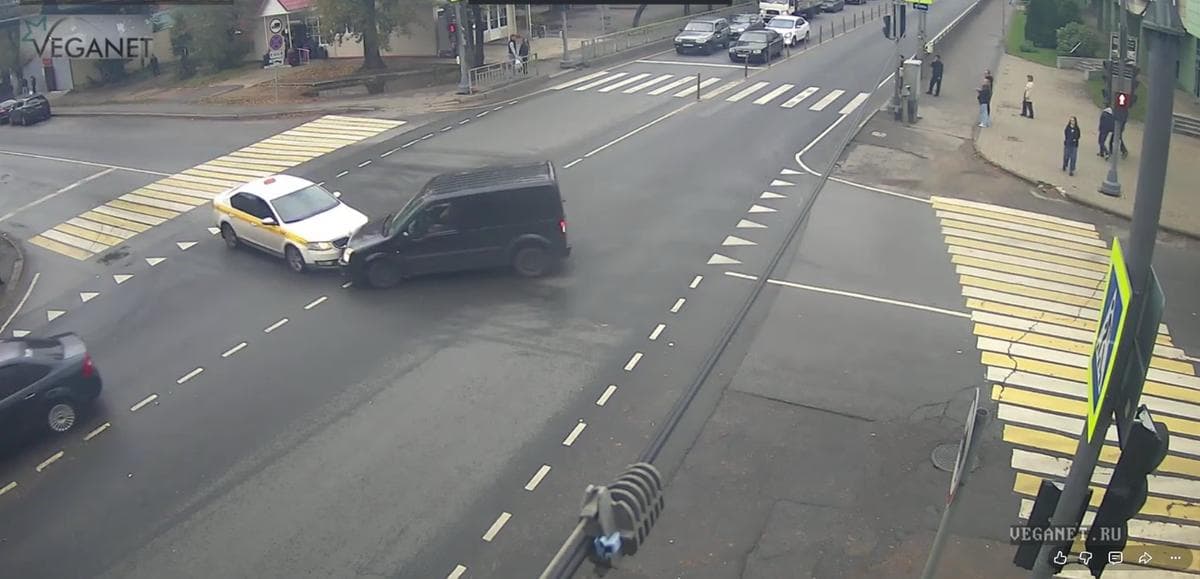
From the perspective of a driver sitting inside the white sedan and looking forward, on which side of their vehicle's front end did the collision occur? Choose one: left or right.
Ground truth
left
The models are asked
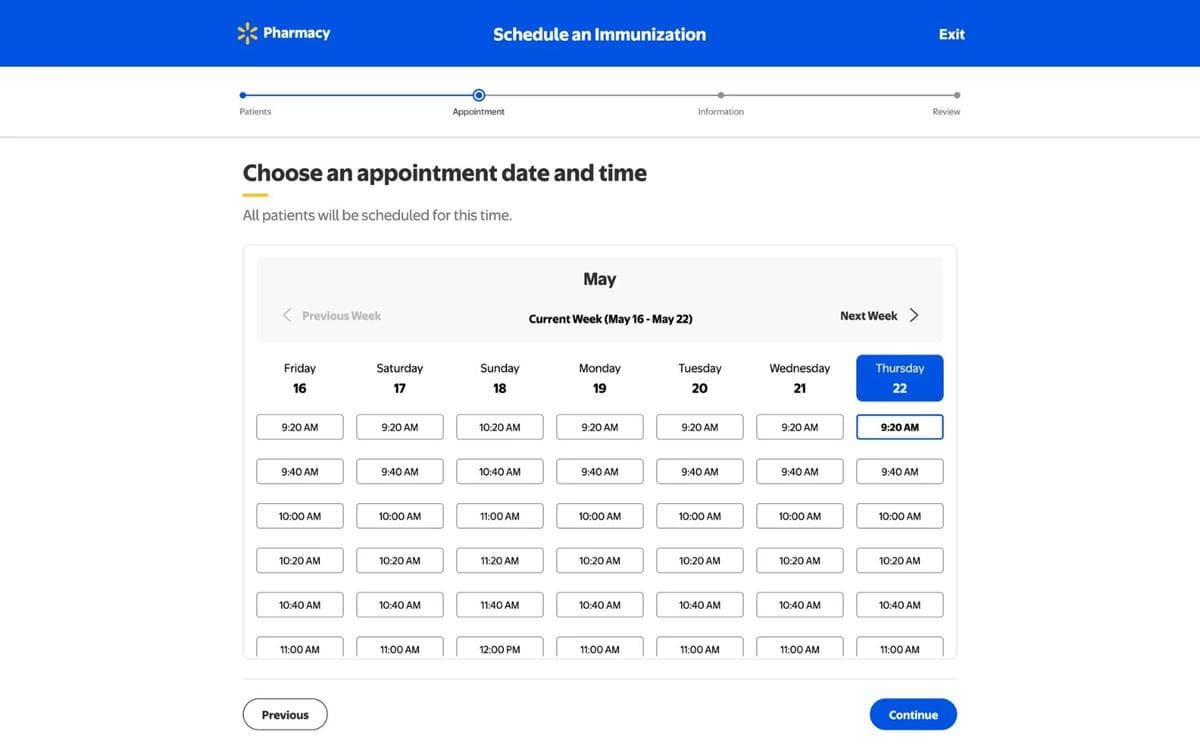
If a patient can only attend appointments at or after 11:00 AM, how many of the displayed time slots across the entire week are available to them? Answer with a single integer.
Ground truth
10
How Reasoning is scored
Each answer is graded against the ground truth by a second model acting as judge, Gemini 3.5 Flash at temperature zero, which credits a correct answer even when the model shows its working. The leaderboard score is the percentage of samples the judge marks correct, with a strict exact-match score reported beside it; models that think out loud show the widest gap between the two. Every task is run at low and high reasoning effort, so a model can appear once per tier, ranked together on the same samples.
Every model runs the same sample set. Under the current protocol each task is run three times at each effort tier and the score is the mean over those runs, shown with its ± range in the table; models benchmarked before the protocol ran once per task and are being re-run under it. Token usage is measured from each provider’s API response, and cost per sample is that usage multiplied by the model’s published pricing. See the full methodology.
Frequently Asked Questions
Each model answers the same reasoning prompts. An LLM judge grades every answer against the ground truth, and the score is the percentage graded correct. The strict-match column shows the percentage that matched the ground truth exactly, which penalizes models that explain their answer.
Strict accuracy counts an answer only when it matches the ground truth exactly after normalization. LLM-judged accuracy asks a second model acting as judge, Gemini 3.5 Flash at temperature zero, to compare the answer with the ground truth and decide whether it is correct, so a right answer still counts when it arrives with an explanation or in different words. The judge is the headline score because it measures whether the model got it right rather than whether it was terse; the strict score sits beside it on each task page, and the gap between the two shows how verbose a model is.
Every task is run at two levels of reasoning effort. The low row is the model answering with minimal deliberation, the high row is the same model on the same questions allowed to think longer. Both rows are ranked together so you can see whether the extra thinking is worth its cost and latency, which the Est. cost and Speed columns show, and the effort filter above the table shows one tier at a time. Models benchmarked before the current protocol have a high-effort row for Reasoning only until they are re-run. Every other table on this site, including the overall Average, uses the low-effort pass so all models are compared on the same amount of compute.
Low and high are benchmark tiers mapped to each model's native reasoning mechanism, because no two labs expose the same control. Claude, GPT, and Grok take low or high as a reasoning effort parameter. Gemini runs at its low and high thinking levels (a minimal versus large thinking budget for the older Gemini 2.5 Pro). Qwen, GLM, and Kimi only expose an on/off thinking mode, so low runs them with thinking disabled and high with thinking at high effort. Muse and Qwen3.8 Max cannot switch reasoning off, so their low pass uses the lowest native setting. All five tasks and the Average use the low pass.
Under the current protocol each task is run three times at each effort tier, and the score shown is the mean over those runs. The ± is half the range between the lowest and highest run, so it shows how much the score moved between runs; it is a range, not a confidence interval. Hover the ± for the run count and range. A score without one comes from a single run; models benchmarked before the protocol are being re-run under it. OCR results are currently a single preliminary run per model, so they carry no ±.
The answer is never written directly in the image. The model has to combine several visual facts, such as reading two values and comparing them, judging spatial relationships, or applying logic to what it sees.
Most models in this leaderboard link to their Playground page. Click the model name to open it, then upload your own image and run it. A few models are benchmarked for comparison only and do not have a Playground page yet.