Visual Identification Benchmark
The Identification task asks each model to recognize and name a specific entity in an image based on visual evidence. The answer might be a brand, an object type, a color, a material, or a printed label. The model must single out the correct target among look-alikes and distractors and return the requested name or descriptor.
Evals updated October 13, 2026Pricing updated October 15, 2026
| 1 | low | 100.0% | 96.9% | 1.3K | $0.014 | 5.60s | ||
| 1 | low | 100.0% | 100.0% | 1.5K | $0.0070 | 5.93s | ||
| 1 | high | 100.0% ±0.0, Mean of 3 runs, range 100.0 to 100.0 | 99.0%±1.6, Mean of 3 runs, range 96.9 to 100.0 | 1.8K | $0.0033 | 10.11s | ||
| 4 | low | 99.0% ±1.6, Mean of 3 runs, range 96.9 to 100.0 | 99.0%±1.6, Mean of 3 runs, range 96.9 to 100.0 | 1.4K | $0.0040 | 4.70s | ||
| 4 | low | 99.0% ±1.6, Mean of 3 runs, range 96.9 to 100.0 | 96.9%±0.0, Mean of 3 runs, range 96.9 to 96.9 | 1.3K | $0.0015 | 7.42s | ||
| 6 | low | 97.9% ±1.6, Mean of 3 runs, range 96.9 to 100.0 | 93.8%±3.1, Mean of 3 runs, range 90.6 to 96.9 | 1.3K | $0.013 | 5.01s | ||
| 6 | low | 97.9% ±1.6, Mean of 3 runs, range 96.9 to 100.0 | 95.8%±1.6, Mean of 3 runs, range 93.8 to 96.9 | 1.3K | $0.0014 | 7.44s | ||
| 6 | high | 97.9% ±1.6, Mean of 3 runs, range 96.9 to 100.0 | 97.9%±1.6, Mean of 3 runs, range 96.9 to 100.0 | 1.7K | $0.0068 | 8.08s | ||
| 9 | high | 96.9% ±3.1, Mean of 3 runs, range 93.8 to 100.0 | 92.7%±4.7, Mean of 3 runs, range 87.5 to 96.9 | 1.3K | $0.014 | 4.95s | ||
| 9 | high | 96.9% ±0.0, Mean of 3 runs, range 96.9 to 96.9 | 96.9%±0.0, Mean of 3 runs, range 96.9 to 96.9 | 1.5K | $0.0057 | 6.24s | ||
| 9 | high | 96.9% ±0.0, Mean of 3 runs, range 96.9 to 96.9 | 93.8%±0.0, Mean of 3 runs, range 93.8 to 93.8 | 1.5K | $0.0021 | 6.28s | ||
| 9 | high | 96.9% ±0.0, Mean of 3 runs, range 96.9 to 96.9 | 95.8%±1.6, Mean of 3 runs, range 93.8 to 96.9 | 1.8K | $0.0034 | 8.12s | ||
| 9 | low | 96.9% ±0.0, Mean of 3 runs, range 96.9 to 96.9 | 95.8%±1.6, Mean of 3 runs, range 93.8 to 96.9 | 1.3K | $0.0013 | 13.22s | ||
| 14 | high | 95.8% ±1.6, Mean of 3 runs, range 93.8 to 96.9 | 87.5%±3.1, Mean of 3 runs, range 84.4 to 90.6 | 1.4K | $0.0067 | 9.81s | ||
| 15 | low | 93.8% | 90.6% | 1.2K | $0.0009 | 2.23s | ||
| 15 | low | 93.8% | 87.5% | 395 | $0.0012 | 2.81s | ||
| 15 | low | 93.8% ±0.0, Mean of 3 runs, range 93.8 to 93.8 | 90.6%±0.0, Mean of 3 runs, range 90.6 to 90.6 | 1.2K | $0.0024 | 3.82s | ||
| 15 | low | 93.8% ±0.0, Mean of 3 runs, range 93.8 to 93.8 | 89.6%±1.6, Mean of 3 runs, range 87.5 to 90.6 | 1.2K | $0.0027 | 4.16s | ||
| 15 | low | 93.8% ±0.0, Mean of 3 runs, range 93.8 to 93.8 | 84.4%±0.0, Mean of 3 runs, range 84.4 to 84.4 | 1.3K | $0.0058 | 6.22s | ||
| 20 | high | 92.7% ±1.6, Mean of 3 runs, range 90.6 to 93.8 | 86.5%±1.6, Mean of 3 runs, range 84.4 to 87.5 | 1.2K | $0.014 | 3.09s | ||
| 20 | high | 92.7% ±1.6, Mean of 3 runs, range 90.6 to 93.8 | 86.5%±1.6, Mean of 3 runs, range 84.4 to 87.5 | 1.2K | $0.0060 | 3.29s | ||
| 20 | high | 92.7% ±1.6, Mean of 3 runs, range 90.6 to 93.8 | 88.5%±1.6, Mean of 3 runs, range 87.5 to 90.6 | 1.3K | $0.0036 | 4.13s | ||
| 20 | Muse WonderNEW | low | 92.7% ±1.6, Mean of 3 runs, range 90.6 to 93.8 | 91.7%±1.6, Mean of 3 runs, range 90.6 to 93.8 | 1.7K | $0.014 | 6.50s | |
| 20 | low | 92.7% ±1.6, Mean of 3 runs, range 90.6 to 93.8 | 92.7%±1.6, Mean of 3 runs, range 90.6 to 93.8 | 1.7K | $0.0036 | 14.53s | ||
| 25 | low | 91.7% ±1.6, Mean of 3 runs, range 90.6 to 93.8 | 89.6%±1.6, Mean of 3 runs, range 87.5 to 90.6 | 1.7K | $0.0033 | 4.42s | ||
| 25 | low | 91.7% ±3.1, Mean of 3 runs, range 87.5 to 93.8 | 78.1%±0.0, Mean of 3 runs, range 78.1 to 78.1 | 1.3K | $0.0029 | 6.51s | ||
| 27 | low | 90.6% | 90.6% | 976 | $0.0002 | 3.23s | ||
| 27 | low | 90.6% | 84.4% | 1.3K | $0.0072 | 3.71s | ||
| 27 | high | 90.6% ±0.0, Mean of 3 runs, range 90.6 to 90.6 | 81.3%±3.1, Mean of 3 runs, range 78.1 to 84.4 | 1.4K | $0.0033 | 5.96s | ||
| 27 | Muse WonderNEW | high | 90.6% ±0.0, Mean of 3 runs, range 90.6 to 90.6 | 90.6%±0.0, Mean of 3 runs, range 90.6 to 90.6 | 2.2K | $0.023 | 11.46s | |
| 31 | low | 89.6% ±1.6, Mean of 3 runs, range 87.5 to 90.6 | 83.3%±1.6, Mean of 3 runs, range 81.3 to 84.4 | 1.2K | $0.013 | 2.47s | ||
| 31 | low | 89.6% ±4.7, Mean of 3 runs, range 84.4 to 93.8 | 85.4%±4.7, Mean of 3 runs, range 81.3 to 90.6 | 1.2K | $0.0056 | 2.97s | ||
| 31 | low | 89.6% ±1.6, Mean of 3 runs, range 87.5 to 90.6 | 86.5%±1.6, Mean of 3 runs, range 84.4 to 87.5 | 1.3K | $0.0087 | 3.66s | ||
| 31 | low | 89.6% ±1.6, Mean of 3 runs, range 87.5 to 90.6 | 89.6%±1.6, Mean of 3 runs, range 87.5 to 90.6 | 1.8K | $0.0038 | 5.78s | ||
| 31 | high | 89.6% ±1.6, Mean of 3 runs, range 87.5 to 90.6 | 88.5%±1.6, Mean of 3 runs, range 87.5 to 90.6 | 2.4K | $0.0065 | 6.72s | ||
| 31 | high | 89.6% ±1.6, Mean of 3 runs, range 87.5 to 90.6 | 89.6%±1.6, Mean of 3 runs, range 87.5 to 90.6 | 1.3K | $0.0037 | 8.44s | ||
| 31 | low | 89.6% ±1.6, Mean of 3 runs, range 87.5 to 90.6 | 83.3%±1.6, Mean of 3 runs, range 81.3 to 84.4 | 1.2K | $0.0025 | 11.77s | ||
| 38 | low | 88.5% ±1.6, Mean of 3 runs, range 87.5 to 90.6 | 83.3%±3.1, Mean of 3 runs, range 81.3 to 87.5 | 981 | $0.0001 | 3.75s | ||
| 38 | low | 88.5% ±1.6, Mean of 3 runs, range 87.5 to 90.6 | 88.5%±1.6, Mean of 3 runs, range 87.5 to 90.6 | 1.1K | $0.0027 | 5.24s | ||
| 38 | high | 88.5% ±1.6, Mean of 3 runs, range 87.5 to 90.6 | 82.3%±1.6, Mean of 3 runs, range 81.3 to 84.4 | 1.2K | $0.0030 | 8.17s | ||
| 38 | high | 88.5% ±1.6, Mean of 3 runs, range 87.5 to 90.6 | 86.5%±3.1, Mean of 3 runs, range 84.4 to 90.6 | 1.6K | $0.018 | 9.26s | ||
| 42 | high | 87.5% ±3.1, Mean of 3 runs, range 84.4 to 90.6 | 76.0%±3.1, Mean of 3 runs, range 71.9 to 78.1 | 1.4K | $0.0002 | 4.10s | ||
| 42 | low | 87.5% ±3.1, Mean of 3 runs, range 84.4 to 90.6 | 77.1%±1.6, Mean of 3 runs, range 75.0 to 78.1 | 1.3K | $0.0002 | 4.72s | ||
| 42 | low | 87.5% ±3.1, Mean of 3 runs, range 84.4 to 90.6 | 81.3%±3.1, Mean of 3 runs, range 78.1 to 84.4 | 2.6K | $0.0063 | 6.18s | ||
| 42 | high | 87.5% ±3.1, Mean of 3 runs, range 84.4 to 90.6 | 82.3%±1.6, Mean of 3 runs, range 81.3 to 84.4 | 1.5K | $0 | 7.53s | ||
| 42 | high | 87.5% ±0.0, Mean of 3 runs, range 87.5 to 87.5 | 87.5%±0.0, Mean of 3 runs, range 87.5 to 87.5 | 2.3K | $0.0062 | 11.32s | ||
| 47 | low | 86.5% ±1.6, Mean of 3 runs, range 84.4 to 87.5 | 78.1%±3.1, Mean of 3 runs, range 75.0 to 81.3 | 1.3K | $0.0034 | 3.02s | ||
| 47 | high | 86.5% ±3.1, Mean of 3 runs, range 84.4 to 90.6 | 80.2%±3.1, Mean of 3 runs, range 78.1 to 84.4 | 1.3K | $0.0038 | 3.80s | ||
| 47 | high | 86.5% ±3.1, Mean of 3 runs, range 84.4 to 90.6 | 81.3%±3.1, Mean of 3 runs, range 78.1 to 84.4 | 1.4K | $0.0003 | 5.76s | ||
| 47 | high | 86.5% ±1.6, Mean of 3 runs, range 84.4 to 87.5 | 80.2%±1.6, Mean of 3 runs, range 78.1 to 81.3 | 1.5K | $0.0003 | 11.62s | ||
| 47 | high | 86.5% ±1.6, Mean of 3 runs, range 84.4 to 87.5 | 86.5%±1.6, Mean of 3 runs, range 84.4 to 87.5 | 2.3K | $0.0063 | 21.06s | ||
| 52 | low | 85.4% ±3.1, Mean of 3 runs, range 81.3 to 87.5 | 85.4%±3.1, Mean of 3 runs, range 81.3 to 87.5 | 1.3K | $0.0009 | 1.50s | ||
| 52 | low | 85.4% ±4.7, Mean of 3 runs, range 81.3 to 90.6 | 82.3%±4.7, Mean of 3 runs, range 78.1 to 87.5 | 1.1K | $0 | 2.95s | ||
| 52 | high | 85.4% ±3.1, Mean of 3 runs, range 81.3 to 87.5 | 80.2%±4.7, Mean of 3 runs, range 75.0 to 84.4 | 2.1K | $0.0067 | 20.02s | ||
| 52 | high | 85.4% ±1.6, Mean of 3 runs, range 84.4 to 87.5 | 85.4%±1.6, Mean of 3 runs, range 84.4 to 87.5 | 3.0K | $0.0044 | 26.22s | ||
| 52 | high | 85.4% ±1.6, Mean of 3 runs, range 84.4 to 87.5 | 81.3%±0.0, Mean of 3 runs, range 81.3 to 81.3 | 3.6K | $0.015 | 36.98s | ||
| 57 | low | 84.4% | 81.3% | 1.2K | $0.0004 | 1.23s | ||
| 57 | low | 84.4% | 84.4% | 981 | $0.0003 | 2.21s | ||
| 57 | low | 84.4% | 75.0% | 1.3K | $0.0067 | 2.30s | ||
| 57 | low | 84.4% | 84.4% | 981 | <$0.0001 | 3.54s | ||
| 57 | low | 84.4% | 84.4% | 1.3K | $0.0015 | 4.59s | ||
| 57 | low | 84.4% | 78.1% | 1.3K | $0.0001 | 6.45s | ||
| 57 | high | 84.4% ±6.3, Mean of 3 runs, range 78.1 to 90.6 | 76.0%±6.3, Mean of 3 runs, range 68.8 to 81.3 | 1.6K | $0.0007 | 6.54s | ||
| 57 | low | 84.4% ±3.1, Mean of 3 runs, range 81.3 to 87.5 | 77.1%±1.6, Mean of 3 runs, range 75.0 to 78.1 | 1.9K | $0.0055 | 7.85s | ||
| 65 | low | 83.3% ±1.6, Mean of 3 runs, range 81.3 to 84.4 | 76.0%±3.1, Mean of 3 runs, range 71.9 to 78.1 | 1.3K | $0.0013 | 2.61s | ||
| 65 | low | 83.3% ±1.6, Mean of 3 runs, range 81.3 to 84.4 | 77.1%±1.6, Mean of 3 runs, range 75.0 to 78.1 | 1.3K | $0.0004 | 3.27s | ||
| 65 | low | 83.3% ±1.6, Mean of 3 runs, range 81.3 to 84.4 | 78.1%±0.0, Mean of 3 runs, range 78.1 to 78.1 | 1.8K | $0.0046 | 9.41s | ||
| 65 | low | 83.3% ±3.1, Mean of 3 runs, range 81.3 to 87.5 | 79.2%±1.6, Mean of 3 runs, range 78.1 to 81.3 | 1.4K | $0.0002 | 14.70s | ||
| 65 | low | 83.3% ±1.6, Mean of 3 runs, range 81.3 to 84.4 | 79.2%±3.1, Mean of 3 runs, range 75.0 to 81.3 | 3.2K | $0 | 18.37s | ||
| 70 | high | 82.3% ±3.1, Mean of 3 runs, range 78.1 to 84.4 | 79.2%±3.1, Mean of 3 runs, range 75.0 to 81.3 | 2.2K | $0.0055 | 9.04s | ||
| 70 | high | 82.3% ±4.7, Mean of 3 runs, range 78.1 to 87.5 | 81.3%±6.3, Mean of 3 runs, range 75.0 to 87.5 | 1.7K | $0.0003 | 16.68s | ||
| 70 | low | 82.3% ±6.3, Mean of 3 runs, range 75.0 to 87.5 | 82.3%±6.3, Mean of 3 runs, range 75.0 to 87.5 | 4.1K | $0 | 25.94s | ||
| 70 | low | 82.3% ±1.6, Mean of 3 runs, range 81.3 to 84.4 | 81.3%±3.1, Mean of 3 runs, range 78.1 to 84.4 | 3.4K | $0 | 44.57s | ||
| 74 | low | 81.3% | 78.1% | 1.4K | $0.0005 | 1.87s | ||
| 74 | low | 81.3% | – | 981 | $0 | 2.14s | ||
| 74 | low | 81.3% | 81.3% | 1.3K | $0.0027 | 2.33s | ||
| 74 | low | 81.3% | 81.3% | 1.3K | $0.0008 | 5.21s | ||
| 74 | low | 81.3% ±3.1, Mean of 3 runs, range 78.1 to 84.4 | 80.2%±1.6, Mean of 3 runs, range 78.1 to 81.3 | 1.8K | $0 | 13.59s | ||
| 79 | high | 80.2% ±1.6, Mean of 3 runs, range 78.1 to 81.3 | 71.9%±0.0, Mean of 3 runs, range 71.9 to 71.9 | 3.1K | $0.0093 | 13.61s | ||
| 79 | low | 80.2% ±1.6, Mean of 3 runs, range 78.1 to 81.3 | 79.2%±3.1, Mean of 3 runs, range 75.0 to 81.3 | 4.0K | $0 | 22.22s | ||
| 79 | low | 80.2% ±4.7, Mean of 3 runs, range 75.0 to 84.4 | 79.2%±3.1, Mean of 3 runs, range 75.0 to 81.3 | 4.4K | $0 | 82.80s | ||
| 82 | low | 79.2% ±1.6, Mean of 3 runs, range 78.1 to 81.3 | 78.1%±3.1, Mean of 3 runs, range 75.0 to 81.3 | 751 | $0 | 12.96s | ||
| 83 | Kimi K2.6 | low | 78.1% | 62.5% | 1.3K | $0.0010 | 5.16s | |
| 83 | high | 78.1% ±4.7, Mean of 3 runs, range 71.9 to 81.3 | 76.0%±6.3, Mean of 3 runs, range 68.8 to 81.3 | 1.9K | $0.0012 | 28.01s | ||
| 85 | low | 77.1% ±1.6, Mean of 3 runs, range 75.0 to 78.1 | 69.8%±4.7, Mean of 3 runs, range 65.6 to 75.0 | 4.3K | $0 | 21.38s | ||
| 86 | low | 76.0% ±1.6, Mean of 3 runs, range 75.0 to 78.1 | 75.0%±0.0, Mean of 3 runs, range 75.0 to 75.0 | 977 | $0.0004 | 3.33s | ||
| 86 | low | 76.0% ±3.1, Mean of 3 runs, range 71.9 to 78.1 | 70.8%±4.7, Mean of 3 runs, range 65.6 to 75.0 | 977 | $0.0001 | 6.00s | ||
| 86 | low | 76.0% ±1.6, Mean of 3 runs, range 75.0 to 78.1 | 75.0%±3.1, Mean of 3 runs, range 71.9 to 78.1 | 1.7K | $0 | 8.55s | ||
| 89 | low | 71.9% ±0.0, Mean of 3 runs, range 71.9 to 71.9 | 65.6%±3.1, Mean of 3 runs, range 62.5 to 68.8 | 1.1K | $0 | 0.48s | ||
| 90 | DeepSeek V4 Flash Vision Exp | low | 68.8% | 68.8% | 392 | $0.0002 | 1.25s | |
| 91 | low | 63.5% ±1.6, Mean of 3 runs, range 62.5 to 65.6 | 61.5%±3.1, Mean of 3 runs, range 59.4 to 65.6 | 4.5K | $0 | 20.20s | ||
| 92 | low | 59.4% ±6.3, Mean of 3 runs, range 53.1 to 65.6 | 44.8%±6.3, Mean of 3 runs, range 40.6 to 53.1 | 987 | $0 | 0.22s | ||
| 93 | low | 54.2% ±1.6, Mean of 3 runs, range 53.1 to 56.3 | 50.0%±3.1, Mean of 3 runs, range 46.9 to 53.1 | 620 | $0 | 3.89s | ||
| 94 | low | 53.1% ±3.1, Mean of 3 runs, range 50.0 to 56.3 | 49.0%±4.7, Mean of 3 runs, range 43.8 to 53.1 | 738 | $0 | 3.94s |

LLM judge: a second model, Gemini 3.5 Flash, compared each answer with the ground truth and decided whether it is correct. Strict: the answer matched the ground truth exactly.
A ± after a score is half the range across that configuration's repeated runs; hover it for the run count and range. Scores without one are single runs. Every model is being re-run three times per task at each effort under the current protocol.
Score vs. cost
Identification score (Accuracy (LLM judge)) against estimated cost per sample, on a log scale. Upper-left is the sweet spot: high quality at low cost.
47 models on the current benchmark · Identification task only, low effort
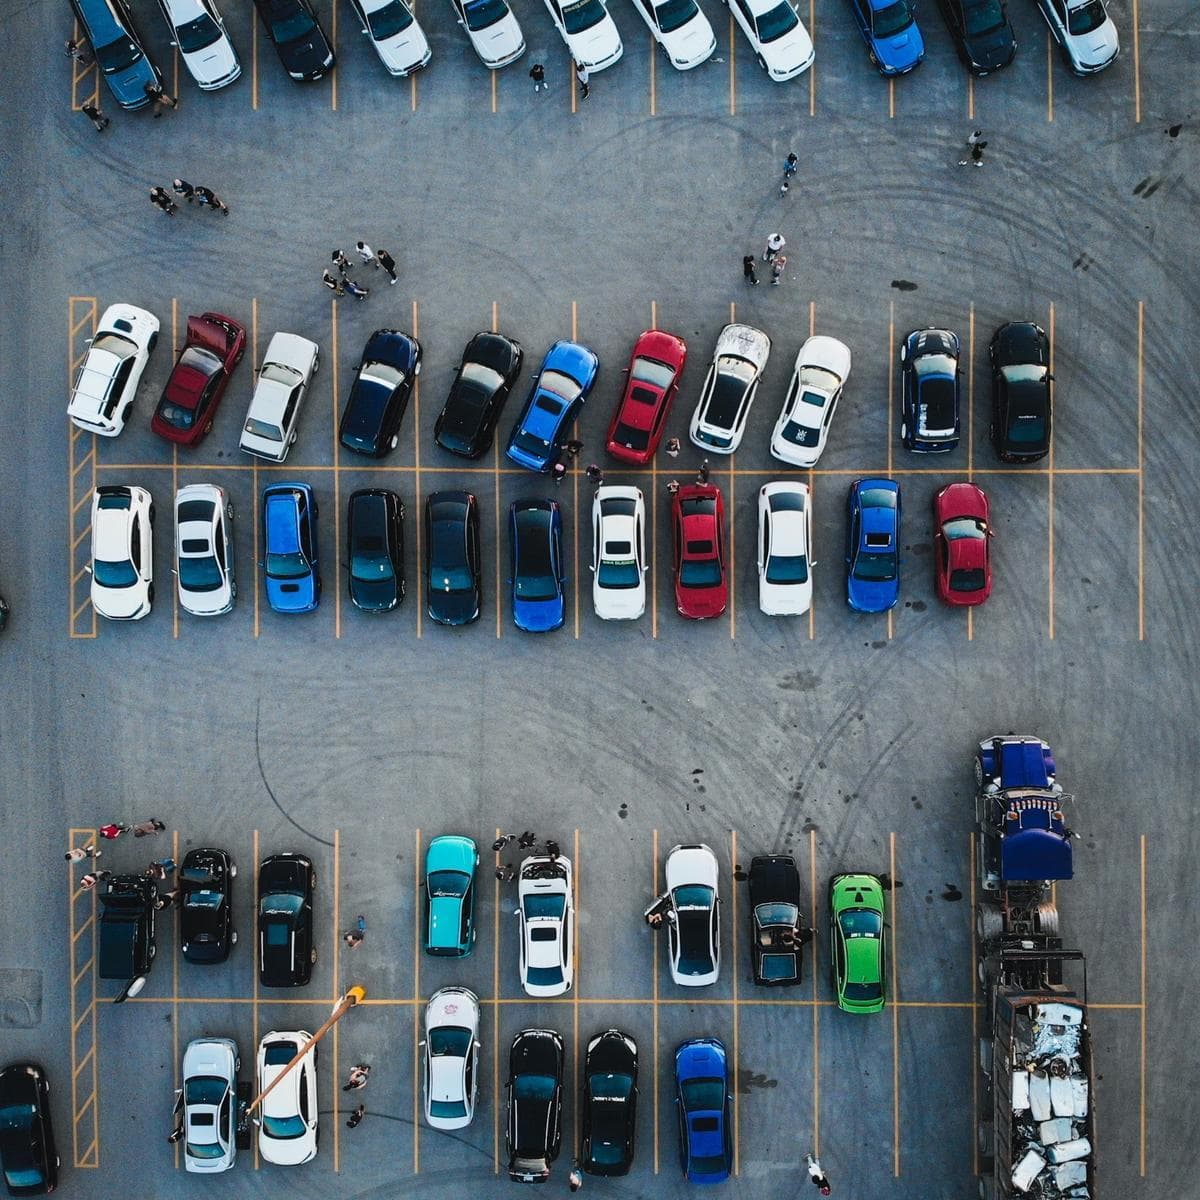
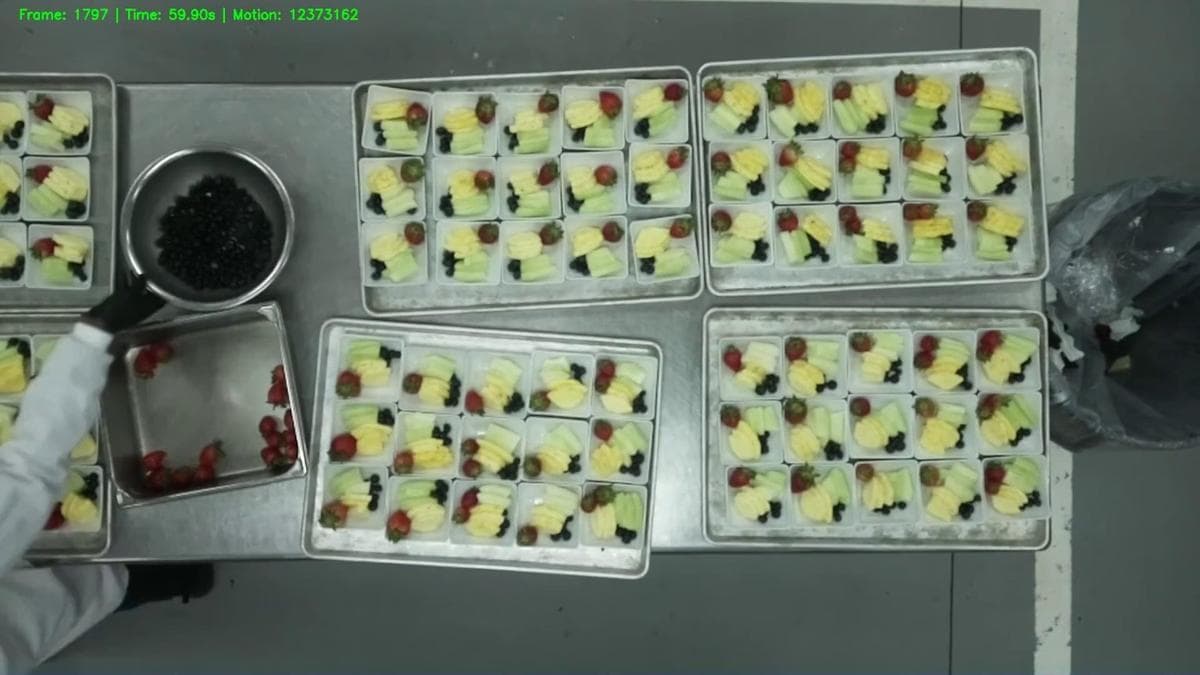
Example Identification benchmark tasks
Real samples from the benchmark: the image each model sees, the question it is asked, and the ground-truth answer it is scored against.
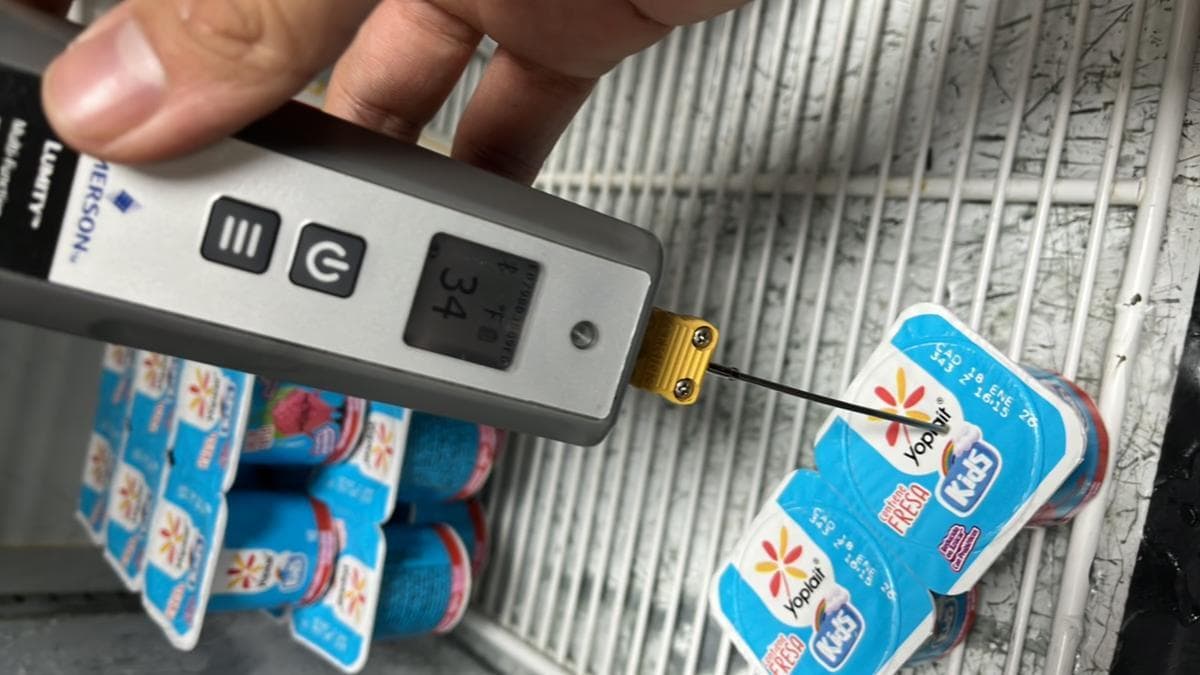
The models are asked
What brand name is printed on the yogurt labels? Output the exact text exactly as printed.
Ground truth
Yoplait
The models are asked
What color is the vehicle parked immediately to the left of the bright green car? Answer strictly with the lowercase color name.
Ground truth
black
The models are asked
What specific type of red fruit is present in both the loose rectangular metal container on the left and inside the small white portion bowls? Answer strictly with the lowercase singular name of the fruit.
Ground truth
strawberry
How Identification is scored
Each answer is graded against the ground-truth name or descriptor by a second model acting as judge, Gemini 3.5 Flash at temperature zero, which credits a correct identification even when it is phrased differently or padded with extra words. The leaderboard score is the percentage of samples the judge marks correct, with a strict exact-match score reported beside it.
Every model runs the same sample set. Under the current protocol each task is run three times at each effort tier and the score is the mean over those runs, shown with its ± range in the table; models benchmarked before the protocol ran once per task and are being re-run under it. Token usage is measured from each provider’s API response, and cost per sample is that usage multiplied by the model’s published pricing. See the full methodology.
Frequently Asked Questions
Each model answers the same identification prompts. An LLM judge grades every answer against the ground-truth name or descriptor, and the score is the percentage graded correct. The strict-match column shows the percentage that matched the ground truth exactly.
Identification asks what something is: a name, brand, color, or material. Detection asks what and where, requiring a bounding box for every object. A model can be good at naming things while being poor at localizing them.
Strict accuracy counts an answer only when it matches the ground truth exactly after normalization. LLM-judged accuracy asks a second model acting as judge, Gemini 3.5 Flash at temperature zero, to compare the answer with the ground truth and decide whether it is correct, so a right answer still counts when it arrives with an explanation or in different words. The judge is the headline score because it measures whether the model got it right rather than whether it was terse; the strict score sits beside it on each task page, and the gap between the two shows how verbose a model is.
Every task is run at two levels of reasoning effort. The low row is the model answering with minimal deliberation, the high row is the same model on the same questions allowed to think longer. Both rows are ranked together so you can see whether the extra thinking is worth its cost and latency, which the Est. cost and Speed columns show, and the effort filter above the table shows one tier at a time. Models benchmarked before the current protocol have a high-effort row for Reasoning only until they are re-run. Every other table on this site, including the overall Average, uses the low-effort pass so all models are compared on the same amount of compute.
Under the current protocol each task is run three times at each effort tier, and the score shown is the mean over those runs. The ± is half the range between the lowest and highest run, so it shows how much the score moved between runs; it is a range, not a confidence interval. Hover the ± for the run count and range. A score without one comes from a single run; models benchmarked before the protocol are being re-run under it. OCR results are currently a single preliminary run per model, so they carry no ±.
Most models in this leaderboard link to their Playground page. Click the model name to open it, then upload your own image and run it. A few models are benchmarked for comparison only and do not have a Playground page yet.