Object Detection Benchmark
The Object Detection task asks each model to locate and classify objects by returning a bounding box and a class label for every one, in the requested output format. Unlike counting or identification, the model must report both what each object is and precisely where it sits in the image. Each prompt restricts the model to a fixed list of class labels.
Evals updated October 13, 2026Pricing updated October 15, 2026
| 1 | high | 85.1% ±0.6, Mean of 3 runs, range 84.3 to 85.5 | 73.3%±0.4, Mean of 3 runs, range 72.8 to 73.5 | 68.2%±0.2, Mean of 3 runs, range 68.0 to 68.4 | 3.7K | $0.027 | 23.94s | ||
| 2 | high | 83.6% ±0.8, Mean of 3 runs, range 82.8 to 84.5 | 67.0%±0.5, Mean of 3 runs, range 66.5 to 67.5 | 61.9%±0.2, Mean of 3 runs, range 61.7 to 62.1 | 3.6K | $0.101 | 31.66s | ||
| 3 | low | 82.5% ±0.5, Mean of 3 runs, range 81.9 to 83.0 | 71.0%±0.6, Mean of 3 runs, range 70.5 to 71.8 | 67.0%±0.4, Mean of 3 runs, range 66.5 to 67.3 | 2.1K | $0.011 | 32.11s | ||
| 4 | low | 82.1% ±0.8, Mean of 3 runs, range 81.0 to 82.7 | 63.8%±0.9, Mean of 3 runs, range 62.9 to 64.8 | 59.1%±1.1, Mean of 3 runs, range 57.8 to 60.0 | 2.6K | $0.050 | 10.96s | ||
| 5 | high | 81.6% ±0.4, Mean of 3 runs, range 81.1 to 82.0 | 64.3%±0.3, Mean of 3 runs, range 64.0 to 64.6 | 60.4%±0.2, Mean of 3 runs, range 60.2 to 60.6 | 3.9K | $0.022 | 32.49s | ||
| 6 | low | 80.8% ±0.1, Mean of 3 runs, range 80.7 to 80.9 | 61.7%±1.0, Mean of 3 runs, range 60.5 to 62.6 | 57.9%±0.8, Mean of 3 runs, range 57.0 to 58.6 | 2.7K | $0.010 | 19.39s | ||
| 7 | high | 78.4% ±0.4, Mean of 3 runs, range 78.1 to 78.9 | 64.6%±0.9, Mean of 3 runs, range 63.9 to 65.8 | 62.3%±0.5, Mean of 3 runs, range 61.9 to 63.0 | 6.0K | $0.030 | 83.04s | ||
| 8 | high | 76.8% ±0.4, Mean of 3 runs, range 76.5 to 77.3 | 63.1%±0.3, Mean of 3 runs, range 62.8 to 63.3 | 59.5%±0.4, Mean of 3 runs, range 59.2 to 59.9 | 3.4K | $0.014 | 9.81s | ||
| 9 | low | 76.7% ±0.3, Mean of 3 runs, range 76.5 to 77.1 | 61.4%±0.3, Mean of 3 runs, range 61.2 to 61.7 | 59.9%±0.3, Mean of 3 runs, range 59.6 to 60.3 | 3.1K | $0.012 | 29.91s | ||
| 10 | high | 76.4% ±1.2, Mean of 3 runs, range 75.0 to 77.4 | 58.8%±2.1, Mean of 3 runs, range 56.5 to 60.7 | 55.6%±1.3, Mean of 3 runs, range 54.0 to 56.6 | 3.8K | $0.022 | 23.63s | ||
| 11 | high | 76.0% ±1.1, Mean of 3 runs, range 74.7 to 77.0 | 60.9%±0.6, Mean of 3 runs, range 60.5 to 61.6 | 58.3%±0.7, Mean of 3 runs, range 57.7 to 59.1 | 3.5K | $0.030 | 12.10s | ||
| 12 | high | 74.8% ±1.1, Mean of 3 runs, range 73.4 to 75.6 | 62.5%±0.4, Mean of 3 runs, range 62.0 to 62.8 | 59.0%±0.7, Mean of 3 runs, range 58.1 to 59.5 | 6.6K | $0.021 | 20.96s | ||
| 13 | low | 74.7% ±0.7, Mean of 3 runs, range 74.1 to 75.5 | 57.0%±0.3, Mean of 3 runs, range 56.8 to 57.3 | 54.0%±0.3, Mean of 3 runs, range 53.7 to 54.3 | 2.7K | $0.011 | 15.60s | ||
| 14 | low | 74.5% ±0.5, Mean of 3 runs, range 74.0 to 75.0 | 60.2%±0.2, Mean of 3 runs, range 60.0 to 60.4 | 57.0%±0.2, Mean of 3 runs, range 56.8 to 57.1 | 3.0K | $0.021 | 9.03s | ||
| 15 | high | 74.3% ±0.8, Mean of 3 runs, range 73.3 to 75.0 | 62.1%±1.3, Mean of 3 runs, range 60.9 to 63.5 | 58.9%±0.9, Mean of 3 runs, range 58.1 to 59.9 | 3.3K | $0.0089 | 22.34s | ||
| 16 | low | 74.3% ±0.9, Mean of 3 runs, range 73.5 to 75.3 | 60.0%±0.8, Mean of 3 runs, range 59.1 to 60.7 | 57.1%±0.4, Mean of 3 runs, range 56.7 to 57.5 | 3.0K | $0.0098 | 13.60s | ||
| 17 | high | 70.7% ±0.4, Mean of 3 runs, range 70.3 to 71.2 | 58.1%±0.7, Mean of 3 runs, range 57.6 to 59.0 | 55.3%±0.5, Mean of 3 runs, range 54.9 to 56.0 | 3.4K | $0.0093 | 26.16s | ||
| 18 | low | 70.6% ±2.0, Mean of 3 runs, range 68.7 to 72.6 | 56.8%±2.0, Mean of 3 runs, range 55.4 to 59.3 | 54.4%±1.7, Mean of 3 runs, range 53.0 to 56.4 | 2.7K | $0.016 | 20.60s | ||
| 19 | low | 70.5% ±1.1, Mean of 3 runs, range 69.4 to 71.5 | 59.3%±0.7, Mean of 3 runs, range 58.5 to 59.8 | 56.4%±0.5, Mean of 3 runs, range 56.0 to 57.0 | 2.2K | $0.0047 | 19.71s | ||
| 20 | high | 69.8% ±1.8, Mean of 3 runs, range 67.5 to 71.1 | 57.1%±2.1, Mean of 3 runs, range 54.6 to 58.9 | 54.3%±1.8, Mean of 3 runs, range 52.0 to 55.6 | 3.3K | $0.021 | 23.88s | ||
| 21 | low | 68.4% ±0.7, Mean of 3 runs, range 67.9 to 69.3 | 46.1%±1.4, Mean of 3 runs, range 44.5 to 47.3 | 45.2%±0.5, Mean of 3 runs, range 44.7 to 45.7 | 3.2K | $0.031 | 18.11s | ||
| 22 | high | 68.4% ±0.8, Mean of 3 runs, range 67.7 to 69.3 | 45.1%±0.5, Mean of 3 runs, range 44.5 to 45.4 | 44.6%±0.5, Mean of 3 runs, range 44.2 to 45.3 | 5.1K | $0.071 | 43.12s | ||
| 23 | high | 68.2% ±1.0, Mean of 3 runs, range 67.2 to 69.2 | 54.3%±0.4, Mean of 3 runs, range 53.8 to 54.6 | 53.0%±0.6, Mean of 3 runs, range 52.3 to 53.6 | 3.9K | $0.0010 | 10.33s | ||
| 24 | low | 68.1% ±0.8, Mean of 3 runs, range 67.3 to 69.0 | 57.3%±0.5, Mean of 3 runs, range 56.7 to 57.6 | 54.5%±0.5, Mean of 3 runs, range 54.0 to 55.0 | 2.0K | $0.0041 | 17.01s | ||
| 25 | high | 68.0% ±0.7, Mean of 3 runs, range 67.3 to 68.6 | 46.7%±1.2, Mean of 3 runs, range 45.7 to 48.0 | 46.2%±0.6, Mean of 3 runs, range 45.6 to 46.8 | 4.5K | $0.0014 | 21.67s | ||
| 26 | low | 67.4% | 55.8% | 52.4% | 1.9K | $0.010 | 8.76s | ||
| 27 | high | 67.0% ±1.6, Mean of 3 runs, range 65.3 to 68.5 | 53.8%±0.8, Mean of 3 runs, range 52.9 to 54.5 | 51.9%±1.0, Mean of 3 runs, range 50.8 to 52.8 | 3.3K | $0.0010 | 15.78s | ||
| 28 | high | 66.1% ±1.4, Mean of 3 runs, range 64.9 to 67.8 | 50.0%±0.9, Mean of 3 runs, range 49.3 to 51.1 | 49.1%±0.9, Mean of 3 runs, range 48.5 to 50.2 | 5.2K | $0 | 39.37s | ||
| 29 | Muse WonderNEW | high | 66.0% ±0.7, Mean of 3 runs, range 65.2 to 66.5 | 51.4%±0.8, Mean of 3 runs, range 50.3 to 52.0 | 48.6%±0.3, Mean of 3 runs, range 48.4 to 49.0 | 4.9K | $0.061 | 18.75s | |
| 30 | low | 65.8% ±0.6, Mean of 3 runs, range 65.1 to 66.2 | 53.7%±0.9, Mean of 3 runs, range 52.9 to 54.8 | 52.3%±0.5, Mean of 3 runs, range 51.8 to 52.8 | 3.3K | $0.0006 | 8.34s | ||
| 31 | low | 65.7% ±1.0, Mean of 3 runs, range 64.6 to 66.5 | 49.8%±0.9, Mean of 3 runs, range 49.0 to 50.9 | 48.8%±0.7, Mean of 3 runs, range 48.3 to 49.7 | 4.8K | $0 | 33.43s | ||
| 32 | low | 65.5% ±0.4, Mean of 3 runs, range 65.2 to 66.0 | 47.2%±0.4, Mean of 3 runs, range 46.8 to 47.6 | 45.4%±0.8, Mean of 3 runs, range 44.8 to 46.4 | 2.9K | $0.0006 | 15.15s | ||
| 33 | Muse WonderNEW | low | 65.1% ±0.8, Mean of 3 runs, range 64.5 to 66.0 | 51.1%±0.5, Mean of 3 runs, range 50.5 to 51.5 | 48.0%±0.6, Mean of 3 runs, range 47.4 to 48.6 | 4.0K | $0.044 | 11.63s | |
| 34 | high | 65.0% ±0.4, Mean of 3 runs, range 64.6 to 65.3 | 40.4%±1.1, Mean of 3 runs, range 39.5 to 41.7 | 39.6%±0.5, Mean of 3 runs, range 39.2 to 40.1 | 3.5K | $0.078 | 17.13s | ||
| 35 | high | 62.3% ±1.2, Mean of 3 runs, range 61.4 to 63.8 | 43.4%±1.0, Mean of 3 runs, range 42.8 to 44.7 | 42.6%±1.1, Mean of 3 runs, range 41.9 to 44.0 | 5.8K | $0.0050 | 38.49s | ||
| 36 | low | 61.4% ±0.5, Mean of 3 runs, range 61.0 to 62.0 | 40.2%±0.9, Mean of 3 runs, range 39.3 to 41.0 | 38.0%±0.9, Mean of 3 runs, range 37.3 to 39.1 | 3.2K | $0.060 | 11.98s | ||
| 37 | high | 61.3% ±0.4, Mean of 3 runs, range 60.8 to 61.6 | 39.1%±1.1, Mean of 3 runs, range 38.3 to 40.6 | 39.0%±0.2, Mean of 3 runs, range 38.9 to 39.2 | 3.9K | $0.026 | 25.23s | ||
| 38 | low | 61.0% ±1.2, Mean of 3 runs, range 59.9 to 62.2 | 42.5%±1.5, Mean of 3 runs, range 41.4 to 44.4 | 42.0%±1.2, Mean of 3 runs, range 41.1 to 43.5 | 3.0K | $0.0015 | 11.19s | ||
| 39 | low | 60.6% ±1.9, Mean of 3 runs, range 58.4 to 62.1 | 40.7%±1.4, Mean of 3 runs, range 39.4 to 42.2 | 39.4%±0.9, Mean of 3 runs, range 38.6 to 40.4 | 3.9K | $0.0097 | 9.44s | ||
| 40 | low | 60.6% ±0.2, Mean of 3 runs, range 60.3 to 60.7 | 40.6%±0.3, Mean of 3 runs, range 40.4 to 40.9 | 39.6%±0.0, Mean of 3 runs, range 39.6 to 39.6 | 2.9K | $0.014 | 11.33s | ||
| 41 | high | 60.5% ±0.3, Mean of 3 runs, range 60.2 to 60.7 | 42.1%±1.9, Mean of 3 runs, range 40.5 to 44.2 | 39.5%±0.8, Mean of 3 runs, range 38.7 to 40.3 | 4.8K | $0.014 | 15.48s | ||
| 42 | low | 60.1% | 48.4% | 45.1% | 2.2K | $0.0013 | 13.21s | ||
| 43 | high | 60.0% ±0.5, Mean of 3 runs, range 59.6 to 60.7 | 40.9%±0.7, Mean of 3 runs, range 40.0 to 41.5 | 38.5%±0.1, Mean of 3 runs, range 38.5 to 38.6 | 5.1K | $0.015 | 12.00s | ||
| 44 | low | 59.8% ±1.1, Mean of 3 runs, range 58.5 to 60.8 | 48.2%±1.5, Mean of 3 runs, range 47.0 to 50.0 | 46.4%±1.3, Mean of 3 runs, range 45.0 to 47.7 | 2.4K | $0.0006 | 10.37s | ||
| 45 | low | 59.7% ±0.9, Mean of 3 runs, range 59.0 to 60.8 | 48.5%±0.5, Mean of 3 runs, range 47.8 to 48.9 | 46.2%±0.3, Mean of 3 runs, range 45.9 to 46.5 | 3.8K | $0 | 17.47s | ||
| 46 | low | 59.3% ±0.7, Mean of 3 runs, range 58.5 to 60.0 | 44.5%±1.5, Mean of 3 runs, range 42.8 to 45.8 | 42.1%±0.6, Mean of 3 runs, range 41.5 to 42.7 | 2.4K | $0.0028 | 18.44s | ||
| 47 | low | 59.0% ±1.0, Mean of 3 runs, range 58.1 to 60.2 | 41.6%±1.7, Mean of 3 runs, range 40.1 to 43.5 | 39.2%±1.2, Mean of 3 runs, range 38.2 to 40.7 | 3.9K | $0.0096 | 8.68s | ||
| 48 | low | 58.6% ±0.7, Mean of 3 runs, range 58.0 to 59.4 | 36.9%±0.8, Mean of 3 runs, range 36.1 to 37.7 | 35.8%±0.5, Mean of 3 runs, range 35.3 to 36.3 | 4.2K | $0.011 | 25.79s | ||
| 49 | low | 57.5% | 46.6% | 44.5% | 2.0K | $0.0023 | 4.09s | ||
| 50 | low | 57.1% ±1.7, Mean of 3 runs, range 55.9 to 59.4 | 48.2%±1.9, Mean of 3 runs, range 46.4 to 50.2 | 45.9%±1.6, Mean of 3 runs, range 44.5 to 47.7 | 2.1K | $0.0041 | 18.59s | ||
| 51 | low | 57.0% ±1.3, Mean of 3 runs, range 56.1 to 58.7 | 45.9%±1.7, Mean of 3 runs, range 44.1 to 47.6 | 43.6%±1.0, Mean of 3 runs, range 42.6 to 44.5 | 3.8K | $0 | 10.26s | ||
| 52 | high | 56.6% ±2.4, Mean of 3 runs, range 54.5 to 59.3 | 33.0%±2.3, Mean of 3 runs, range 30.9 to 35.4 | 33.5%±1.6, Mean of 3 runs, range 32.0 to 35.2 | 5.5K | $0.017 | 39.05s | ||
| 53 | low | 56.5% | 39.9% | 39.2% | 3.3K | $0.0052 | 8.59s | ||
| 54 | low | 56.4% | 31.0% | 31.4% | 3.2K | $0.059 | 12.78s | ||
| 55 | low | 54.4% | 30.2% | 30.5% | 3.1K | $0.027 | 11.20s | ||
| 56 | low | 54.3% | 42.1% | 40.8% | 4.0K | $0 | 92.14s | ||
| 57 | low | 52.9% ±3.2, Mean of 3 runs, range 49.5 to 55.9 | 42.0%±2.2, Mean of 3 runs, range 39.8 to 44.1 | 40.3%±2.3, Mean of 3 runs, range 37.9 to 42.5 | 5.7K | $0 | 24.78s | ||
| 58 | low | 52.1% | 42.9% | 40.3% | 3.1K | $0.0014 | 18.26s | ||
| 59 | low | 51.9% | 41.5% | 40.4% | 4.3K | $0.010 | 23.23s | ||
| 60 | low | 50.5% ±3.5, Mean of 3 runs, range 46.1 to 53.0 | 39.7%±3.8, Mean of 3 runs, range 35.4 to 42.9 | 38.4%±3.2, Mean of 3 runs, range 34.4 to 40.8 | 5.5K | $0 | 66.38s | ||
| 61 | high | 50.2% ±2.5, Mean of 3 runs, range 48.0 to 53.0 | 32.8%±1.6, Mean of 3 runs, range 30.9 to 34.1 | 32.4%±1.3, Mean of 3 runs, range 31.0 to 33.6 | 12.1K | $0.023 | 172.22s | ||
| 62 | low | 47.5% ±0.6, Mean of 3 runs, range 46.8 to 48.0 | 27.7%±0.2, Mean of 3 runs, range 27.5 to 27.8 | 29.4%±0.1, Mean of 3 runs, range 29.3 to 29.5 | 2.9K | $0 | 55.96s | ||
| 63 | high | 46.7% ±0.8, Mean of 3 runs, range 45.7 to 47.3 | 32.9%±1.0, Mean of 3 runs, range 32.2 to 34.1 | 32.3%±0.9, Mean of 3 runs, range 31.4 to 33.2 | 4.5K | $0.0030 | 45.14s | ||
| 64 | DeepSeek V4 Flash Vision Exp | low | 45.3% | 28.8% | 29.9% | 1.1K | $0.0011 | 7.05s | |
| 65 | high | 45.0% ±2.5, Mean of 3 runs, range 42.2 to 47.1 | 32.3%±2.0, Mean of 3 runs, range 29.9 to 33.8 | 31.2%±1.9, Mean of 3 runs, range 28.8 to 32.7 | 4.3K | $0.0009 | 28.18s | ||
| 66 | high | 44.2% ±0.6, Mean of 3 runs, range 43.5 to 44.8 | 24.0%±1.8, Mean of 3 runs, range 21.8 to 25.3 | 24.0%±0.8, Mean of 3 runs, range 23.0 to 24.6 | 6.0K | $0.130 | 53.30s | ||
| 67 | low | 44.2% ±0.7, Mean of 3 runs, range 43.5 to 44.8 | 29.9%±0.5, Mean of 3 runs, range 29.2 to 30.3 | 29.6%±0.5, Mean of 3 runs, range 29.3 to 30.3 | 3.8K | $0 | 33.16s | ||
| 68 | low | 43.6% ±2.2, Mean of 3 runs, range 41.7 to 46.1 | 21.1%±1.4, Mean of 3 runs, range 19.8 to 22.6 | 22.5%±1.2, Mean of 3 runs, range 21.5 to 23.9 | 2.9K | $0.034 | 13.09s | ||
| 69 | low | 42.8% | 32.9% | 31.1% | 2.2K | $0.0001 | 9.54s | ||
| 70 | low | 42.0% ±1.1, Mean of 3 runs, range 40.9 to 43.1 | 32.3%±1.3, Mean of 3 runs, range 31.4 to 33.9 | 31.0%±1.1, Mean of 3 runs, range 30.2 to 32.4 | 2.6K | $0.0014 | 15.50s | ||
| 71 | high | 41.2% ±1.6, Mean of 3 runs, range 39.6 to 42.8 | 23.7%±1.6, Mean of 3 runs, range 22.1 to 25.3 | 24.4%±0.8, Mean of 3 runs, range 23.7 to 25.3 | 6.6K | $0.028 | 49.09s | ||
| 72 | low | 41.0% | 22.3% | 23.0% | 3.1K | $0.0017 | 15.03s | ||
| 73 | low | 40.4% ±0.6, Mean of 3 runs, range 39.8 to 41.0 | 23.0%±1.0, Mean of 3 runs, range 22.2 to 24.1 | 23.6%±0.6, Mean of 3 runs, range 22.9 to 24.1 | 5.3K | $0.021 | 32.56s | ||
| 74 | low | 38.6% | 29.2% | 27.9% | 2.0K | $0.0031 | 5.86s | ||
| 75 | low | 38.6% | 13.3% | 16.8% | 3.0K | $0.026 | 8.34s | ||
| 76 | low | 38.1% ±3.6, Mean of 3 runs, range 34.3 to 41.5 | 30.2%±1.6, Mean of 3 runs, range 28.3 to 31.5 | 28.9%±1.9, Mean of 3 runs, range 27.0 to 30.8 | 6.0K | $0 | 21.74s | ||
| 76 | low | 38.1% ±5.7, Mean of 3 runs, range 33.5 to 44.9 | 26.6%±4.6, Mean of 3 runs, range 23.3 to 32.5 | 26.7%±4.3, Mean of 3 runs, range 23.6 to 32.2 | 6.3K | $0 | 32.56s | ||
| 78 | low | 37.8% ±1.1, Mean of 3 runs, range 36.4 to 38.7 | 28.5%±0.6, Mean of 3 runs, range 27.9 to 29.2 | 27.0%±0.6, Mean of 3 runs, range 26.3 to 27.4 | 2.5K | $0.0004 | 13.02s | ||
| 79 | low | 36.1% | 15.8% | 18.1% | 3.1K | $0.011 | 7.19s | ||
| 80 | Kimi K2.6 | low | 35.7% | 26.7% | 26.8% | 3.5K | $0.0059 | 64.70s | |
| 81 | low | 35.0% ±1.5, Mean of 3 runs, range 33.2 to 36.1 | 28.6%±1.3, Mean of 3 runs, range 27.0 to 29.6 | 27.6%±1.2, Mean of 3 runs, range 26.1 to 28.4 | 4.1K | $0 | 15.57s | ||
| 82 | low | 33.7% | 25.1% | 24.7% | 1.4K | $0.010 | 10.06s | ||
| 83 | low | 33.1% | 17.9% | 19.0% | 3.9K | $0.0008 | 9.10s | ||
| 84 | low | 31.5% ±1.9, Mean of 3 runs, range 29.9 to 33.7 | 24.3%±1.6, Mean of 3 runs, range 22.9 to 26.2 | 23.6%±1.4, Mean of 3 runs, range 22.4 to 25.2 | 7.2K | $0 | 18.83s | ||
| 85 | high | 24.0% ±1.0, Mean of 3 runs, range 23.1 to 25.1 | 6.1%±0.3, Mean of 3 runs, range 5.8 to 6.4 | 9.5%±0.6, Mean of 3 runs, range 8.8 to 10.0 | 8.4K | $0.041 | 107.46s | ||
| 86 | low | 23.8% ±1.1, Mean of 3 runs, range 22.7 to 24.9 | 16.6%±1.5, Mean of 3 runs, range 14.9 to 18.0 | 16.4%±1.1, Mean of 3 runs, range 15.3 to 17.4 | 1.1K | $0 | 5.39s | ||
| 87 | low | 23.8% ±2.8, Mean of 3 runs, range 20.2 to 25.9 | 6.0%±1.2, Mean of 3 runs, range 4.6 to 7.0 | 9.5%±1.2, Mean of 3 runs, range 8.0 to 10.4 | 3.5K | $0.013 | 25.20s | ||
| 88 | low | 19.0% ±1.2, Mean of 3 runs, range 18.0 to 20.4 | 12.7%±1.9, Mean of 3 runs, range 10.7 to 14.4 | 12.3%±1.1, Mean of 3 runs, range 11.3 to 13.5 | 999 | $0 | 3.20s | ||
| 89 | low | 19.0% ±0.8, Mean of 3 runs, range 18.0 to 19.6 | 5.0%±0.8, Mean of 3 runs, range 4.4 to 6.0 | 7.9%±0.3, Mean of 3 runs, range 7.5 to 8.1 | 3.2K | $0.011 | 27.26s | ||
| 90 | high | 17.8% ±0.3, Mean of 3 runs, range 17.5 to 18.0 | 2.7%±0.4, Mean of 3 runs, range 2.4 to 3.1 | 6.4%±0.2, Mean of 3 runs, range 6.2 to 6.6 | 4.6K | $0.020 | 43.40s | ||
| 91 | high | 16.6% ±0.8, Mean of 3 runs, range 15.8 to 17.4 | 3.0%±0.8, Mean of 3 runs, range 2.0 to 3.6 | 5.8%±0.1, Mean of 3 runs, range 5.7 to 5.9 | 8.2K | $0.030 | 42.45s | ||
| 92 | low | 15.8% ±0.4, Mean of 3 runs, range 15.3 to 16.1 | 3.3%±0.2, Mean of 3 runs, range 3.0 to 3.5 | 5.9%±0.2, Mean of 3 runs, range 5.7 to 6.1 | 2.5K | $0.0044 | 7.32s | ||
| 93 | low | 2.5% ±1.9, Mean of 3 runs, range 1.1 to 5.0 | 0.0%±0.0, Mean of 3 runs, range 0.0 to 0.1 | 0.7%±0.7, Mean of 3 runs, range 0.2 to 1.6 | 2.2K | $0 | 2.17s | ||
| 94 | low | 0.0% ±0.0, Mean of 3 runs, range 0.0 to 0.0 | 0.0%±0.0, Mean of 3 runs, range 0.0 to 0.0 | 0.0%±0.0, Mean of 3 runs, range 0.0 to 0.0 | 2.7K | $0 | 21.34s |

A ± after a score is half the range across that configuration's repeated runs; hover it for the run count and range. Scores without one are single runs. Every model is being re-run three times per task at each effort under the current protocol.
Score vs. cost
Object Detection score (mAP@50) against estimated cost per sample, on a log scale. Upper-left is the sweet spot: high quality at low cost.
47 models on the current benchmark · Object Detection task only, low effort
Example Object Detection benchmark tasks
Real samples from the benchmark: the image each model sees, the question it is asked, and the ground-truth answer it is scored against.
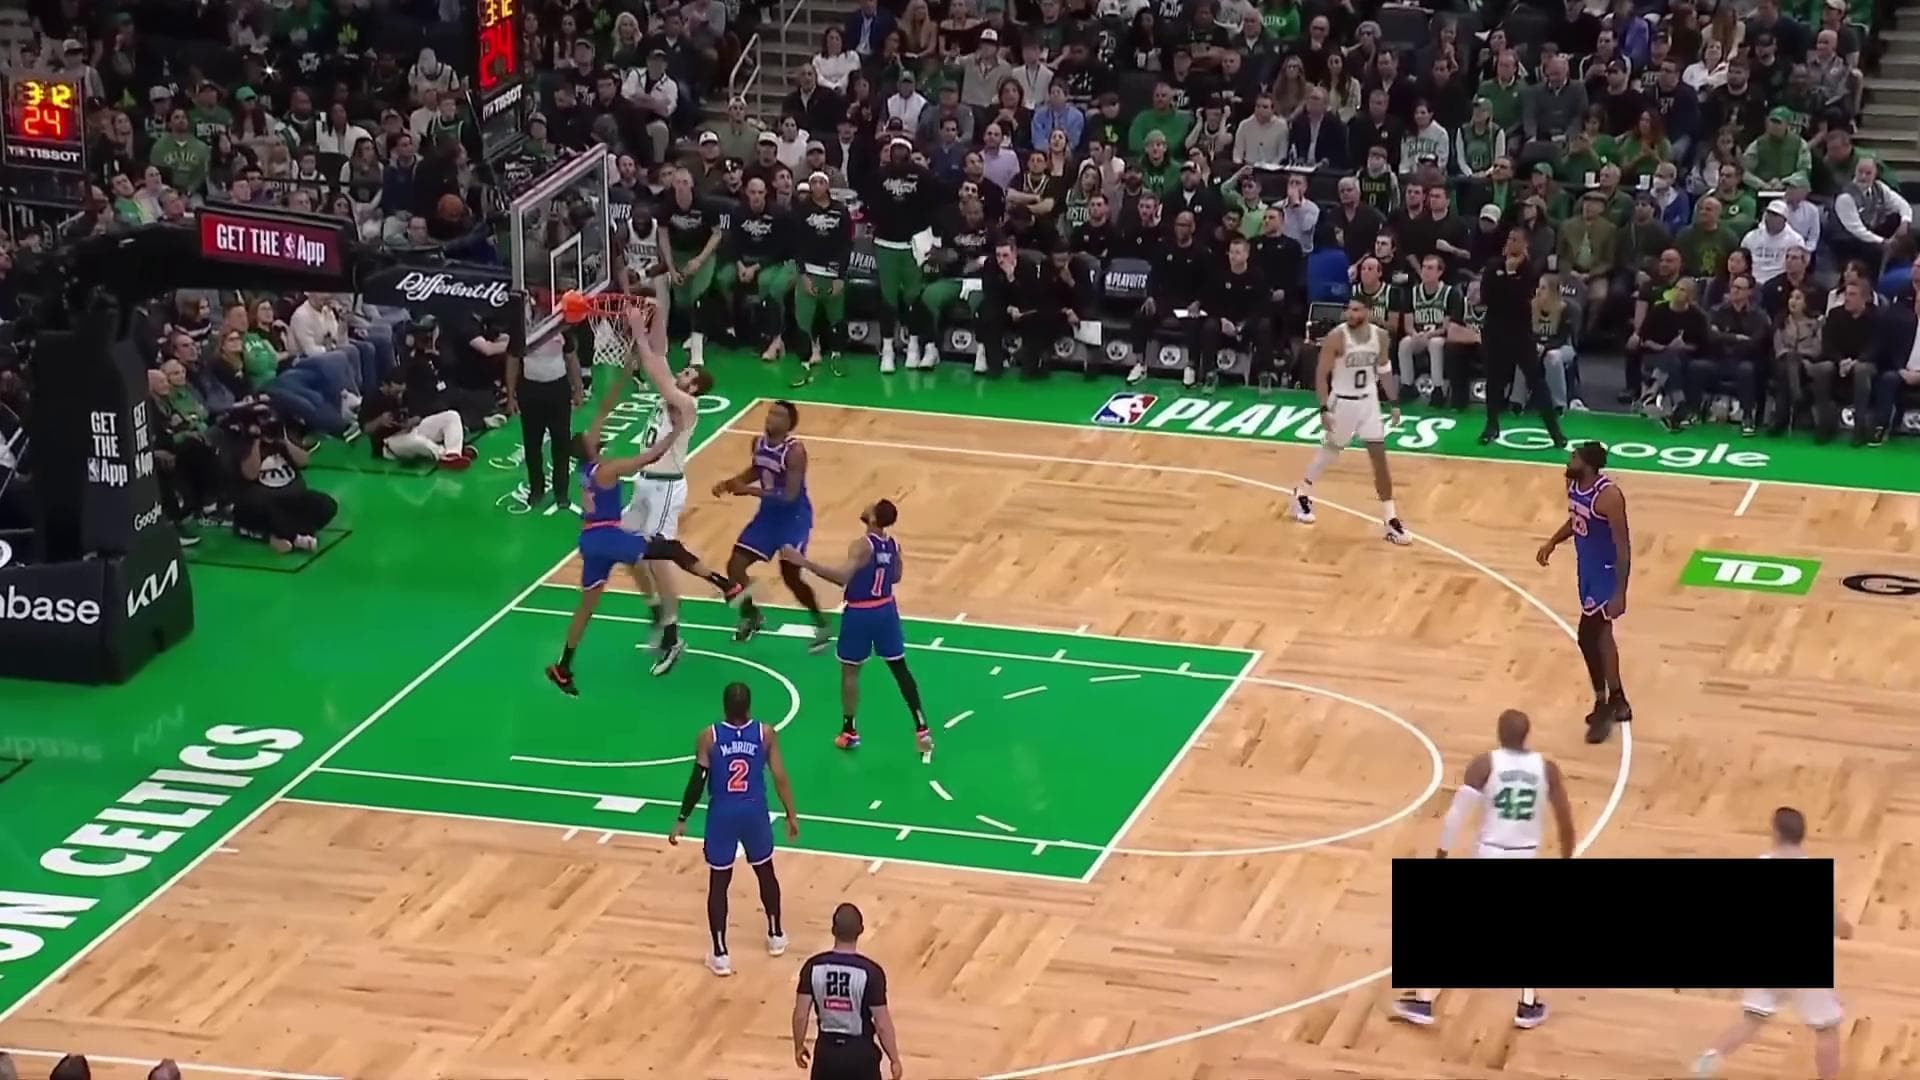
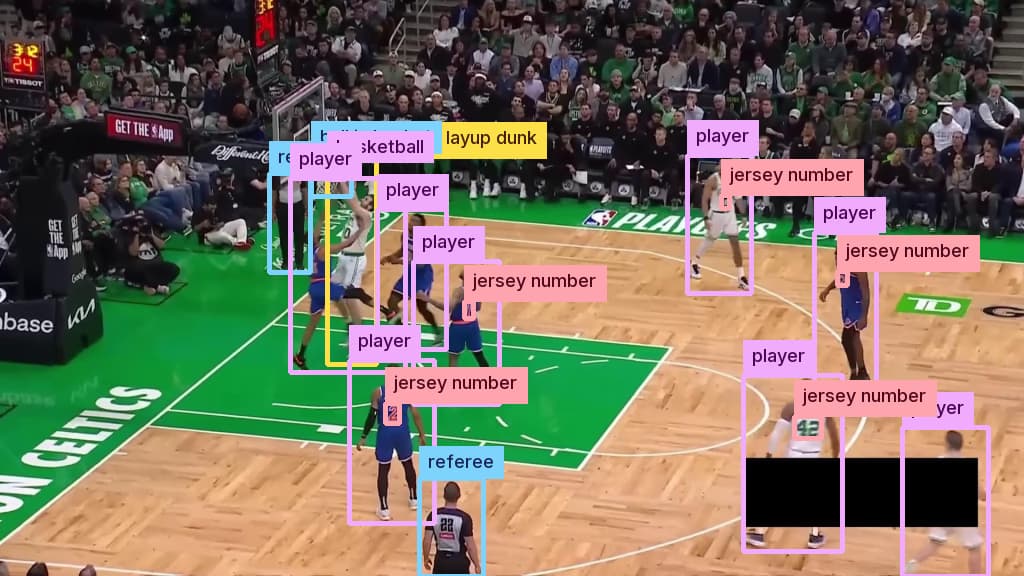
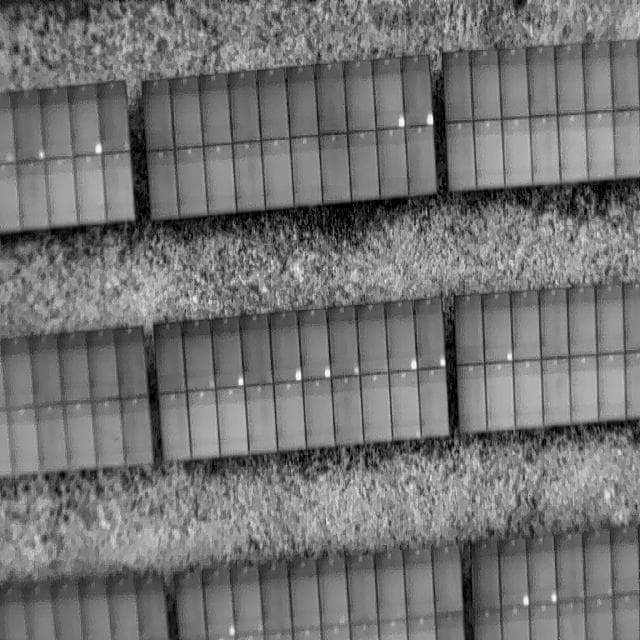
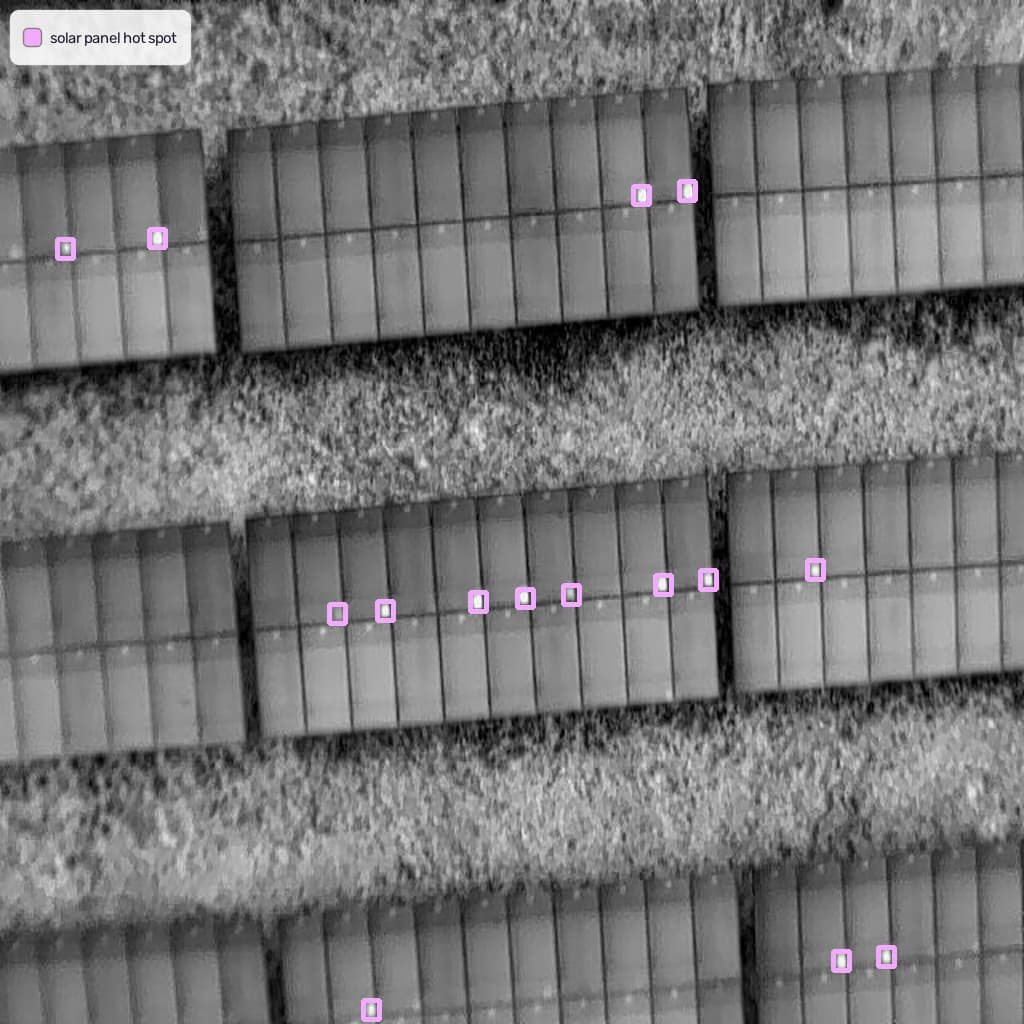
The models are asked
Detect all objects in this image. Output a JSON list where each entry contains the 2D bounding box in the key "box_2d" and the text label in the key "label". The "box_2d" value must be [y_min, x_min, y_max, x_max]: integers between 0 and 1000, normalized to the image height and width. Return only the JSON list, with no extra text. Only use these labels: ball in basket, basket rim, basketball, jersey number, player, player doing layup dunk, referee
Ground truth
19 objects
The models are asked
Detect all objects in this image. Output a JSON list where each entry contains the 2D bounding box in the key "box_2d" and the text label in the key "label". The "box_2d" value must be [y_min, x_min, y_max, x_max]: integers between 0 and 1000, normalized to the image height and width. Return only the JSON list, with no extra text. Only use these labels: solar panel hot spot
Ground truth
15 objects
The models are asked
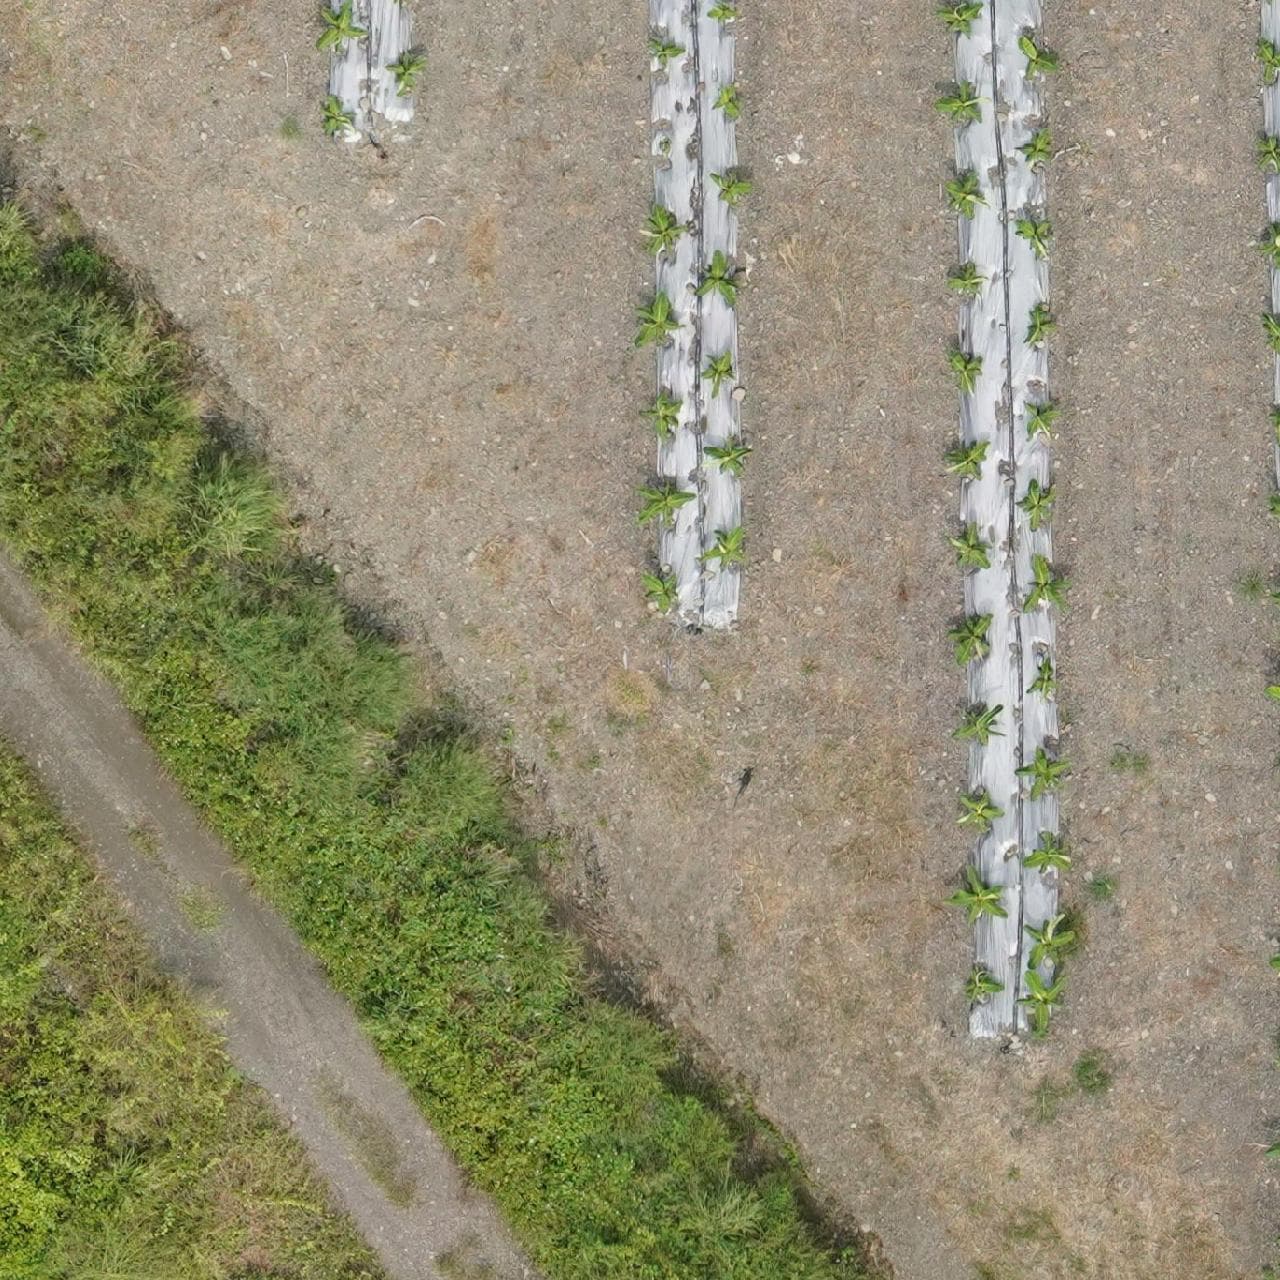
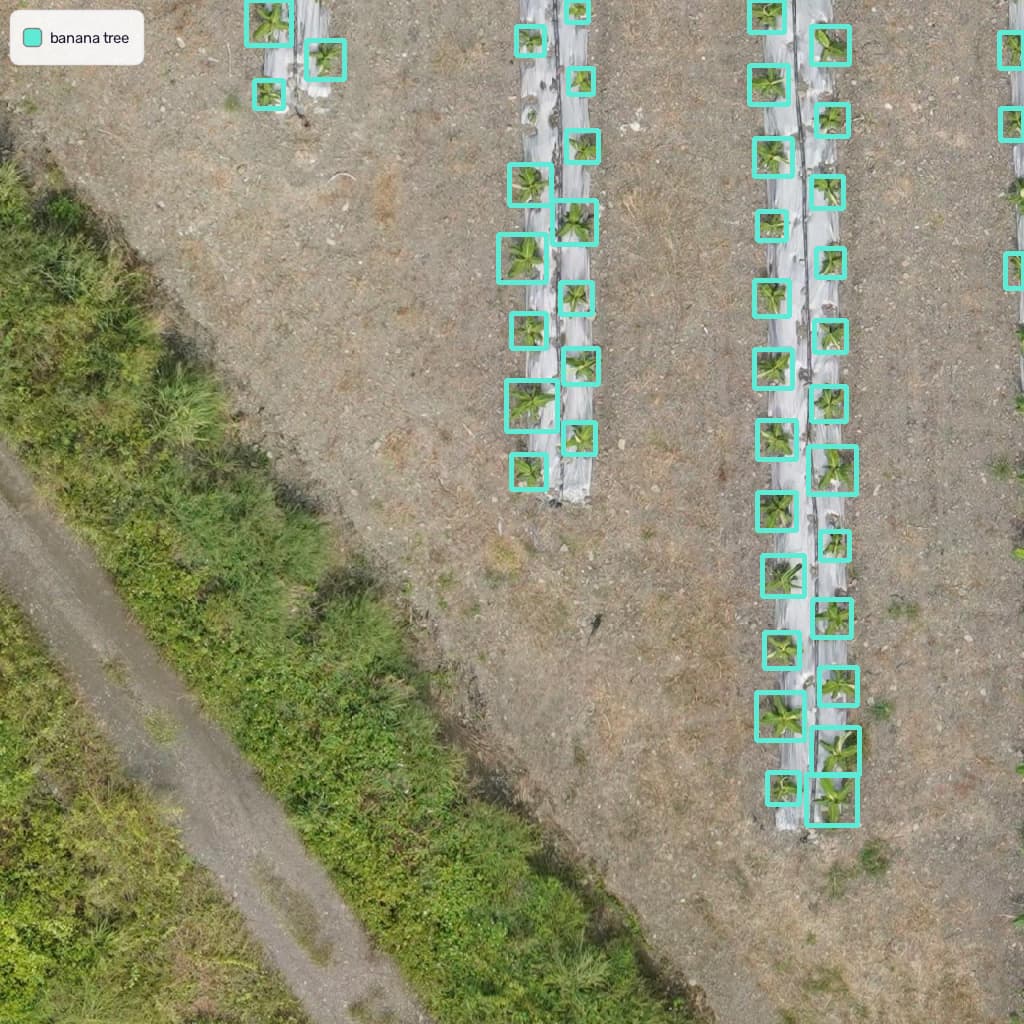
Detect all objects in this image. Output a JSON list where each entry contains the 2D bounding box in the key "box_2d" and the text label in the key "label". The "box_2d" value must be [y_min, x_min, y_max, x_max]: integers between 0 and 1000, normalized to the image height and width. Return only the JSON list, with no extra text. Only use these labels: banana tree
Ground truth
43 objects
The models are asked
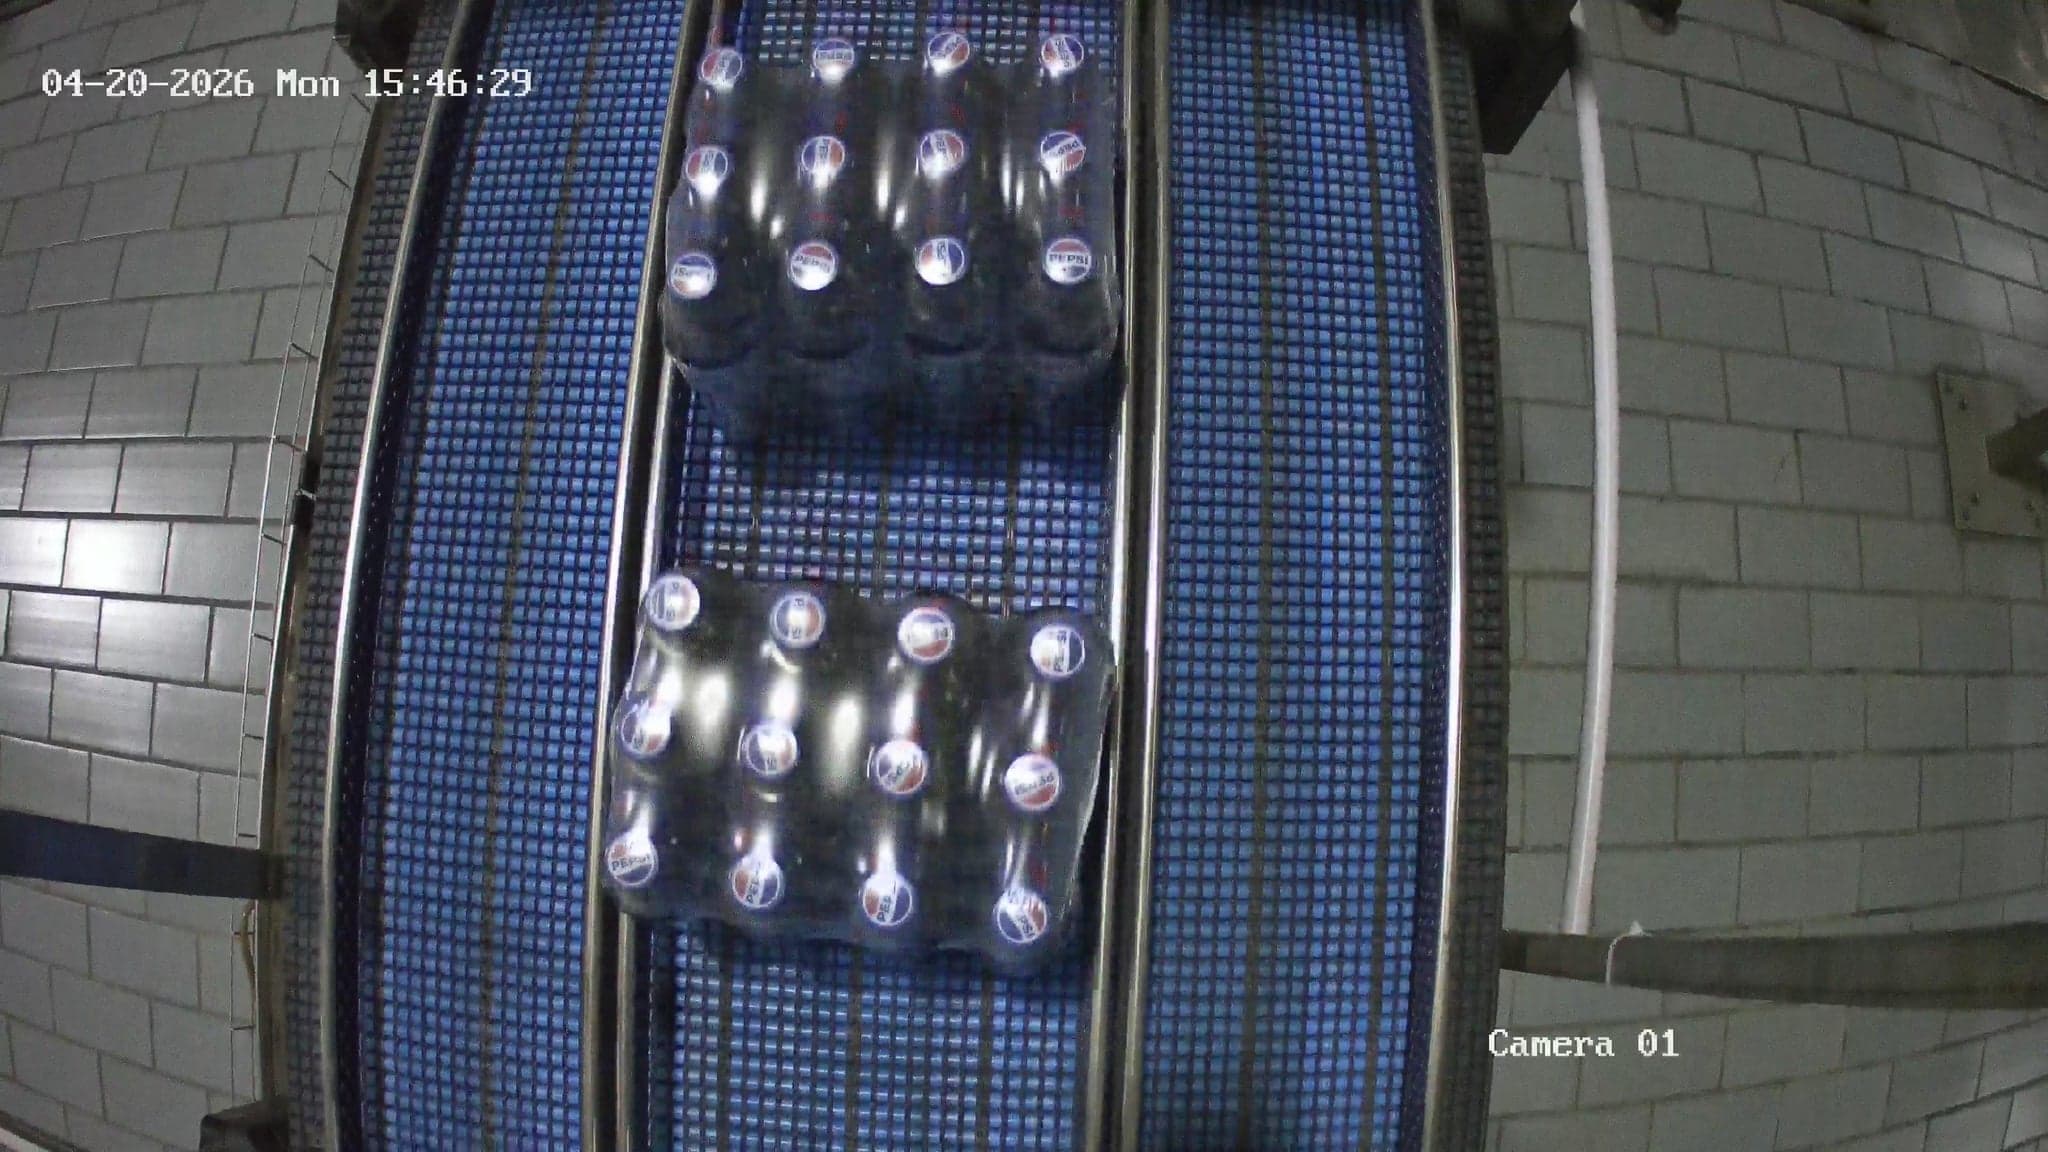
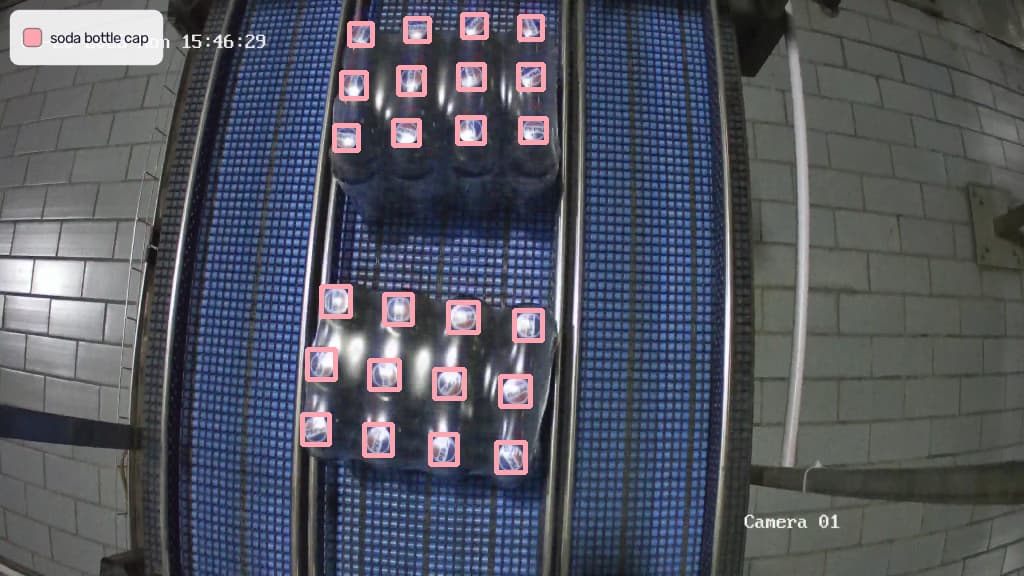
Detect all objects in this image. Output a JSON list where each entry contains the 2D bounding box in the key "box_2d" and the text label in the key "label". The "box_2d" value must be [y_min, x_min, y_max, x_max]: integers between 0 and 1000, normalized to the image height and width. Return only the JSON list, with no extra text. Only use these labels: soda bottle cap
Ground truth
24 objects
The models are asked
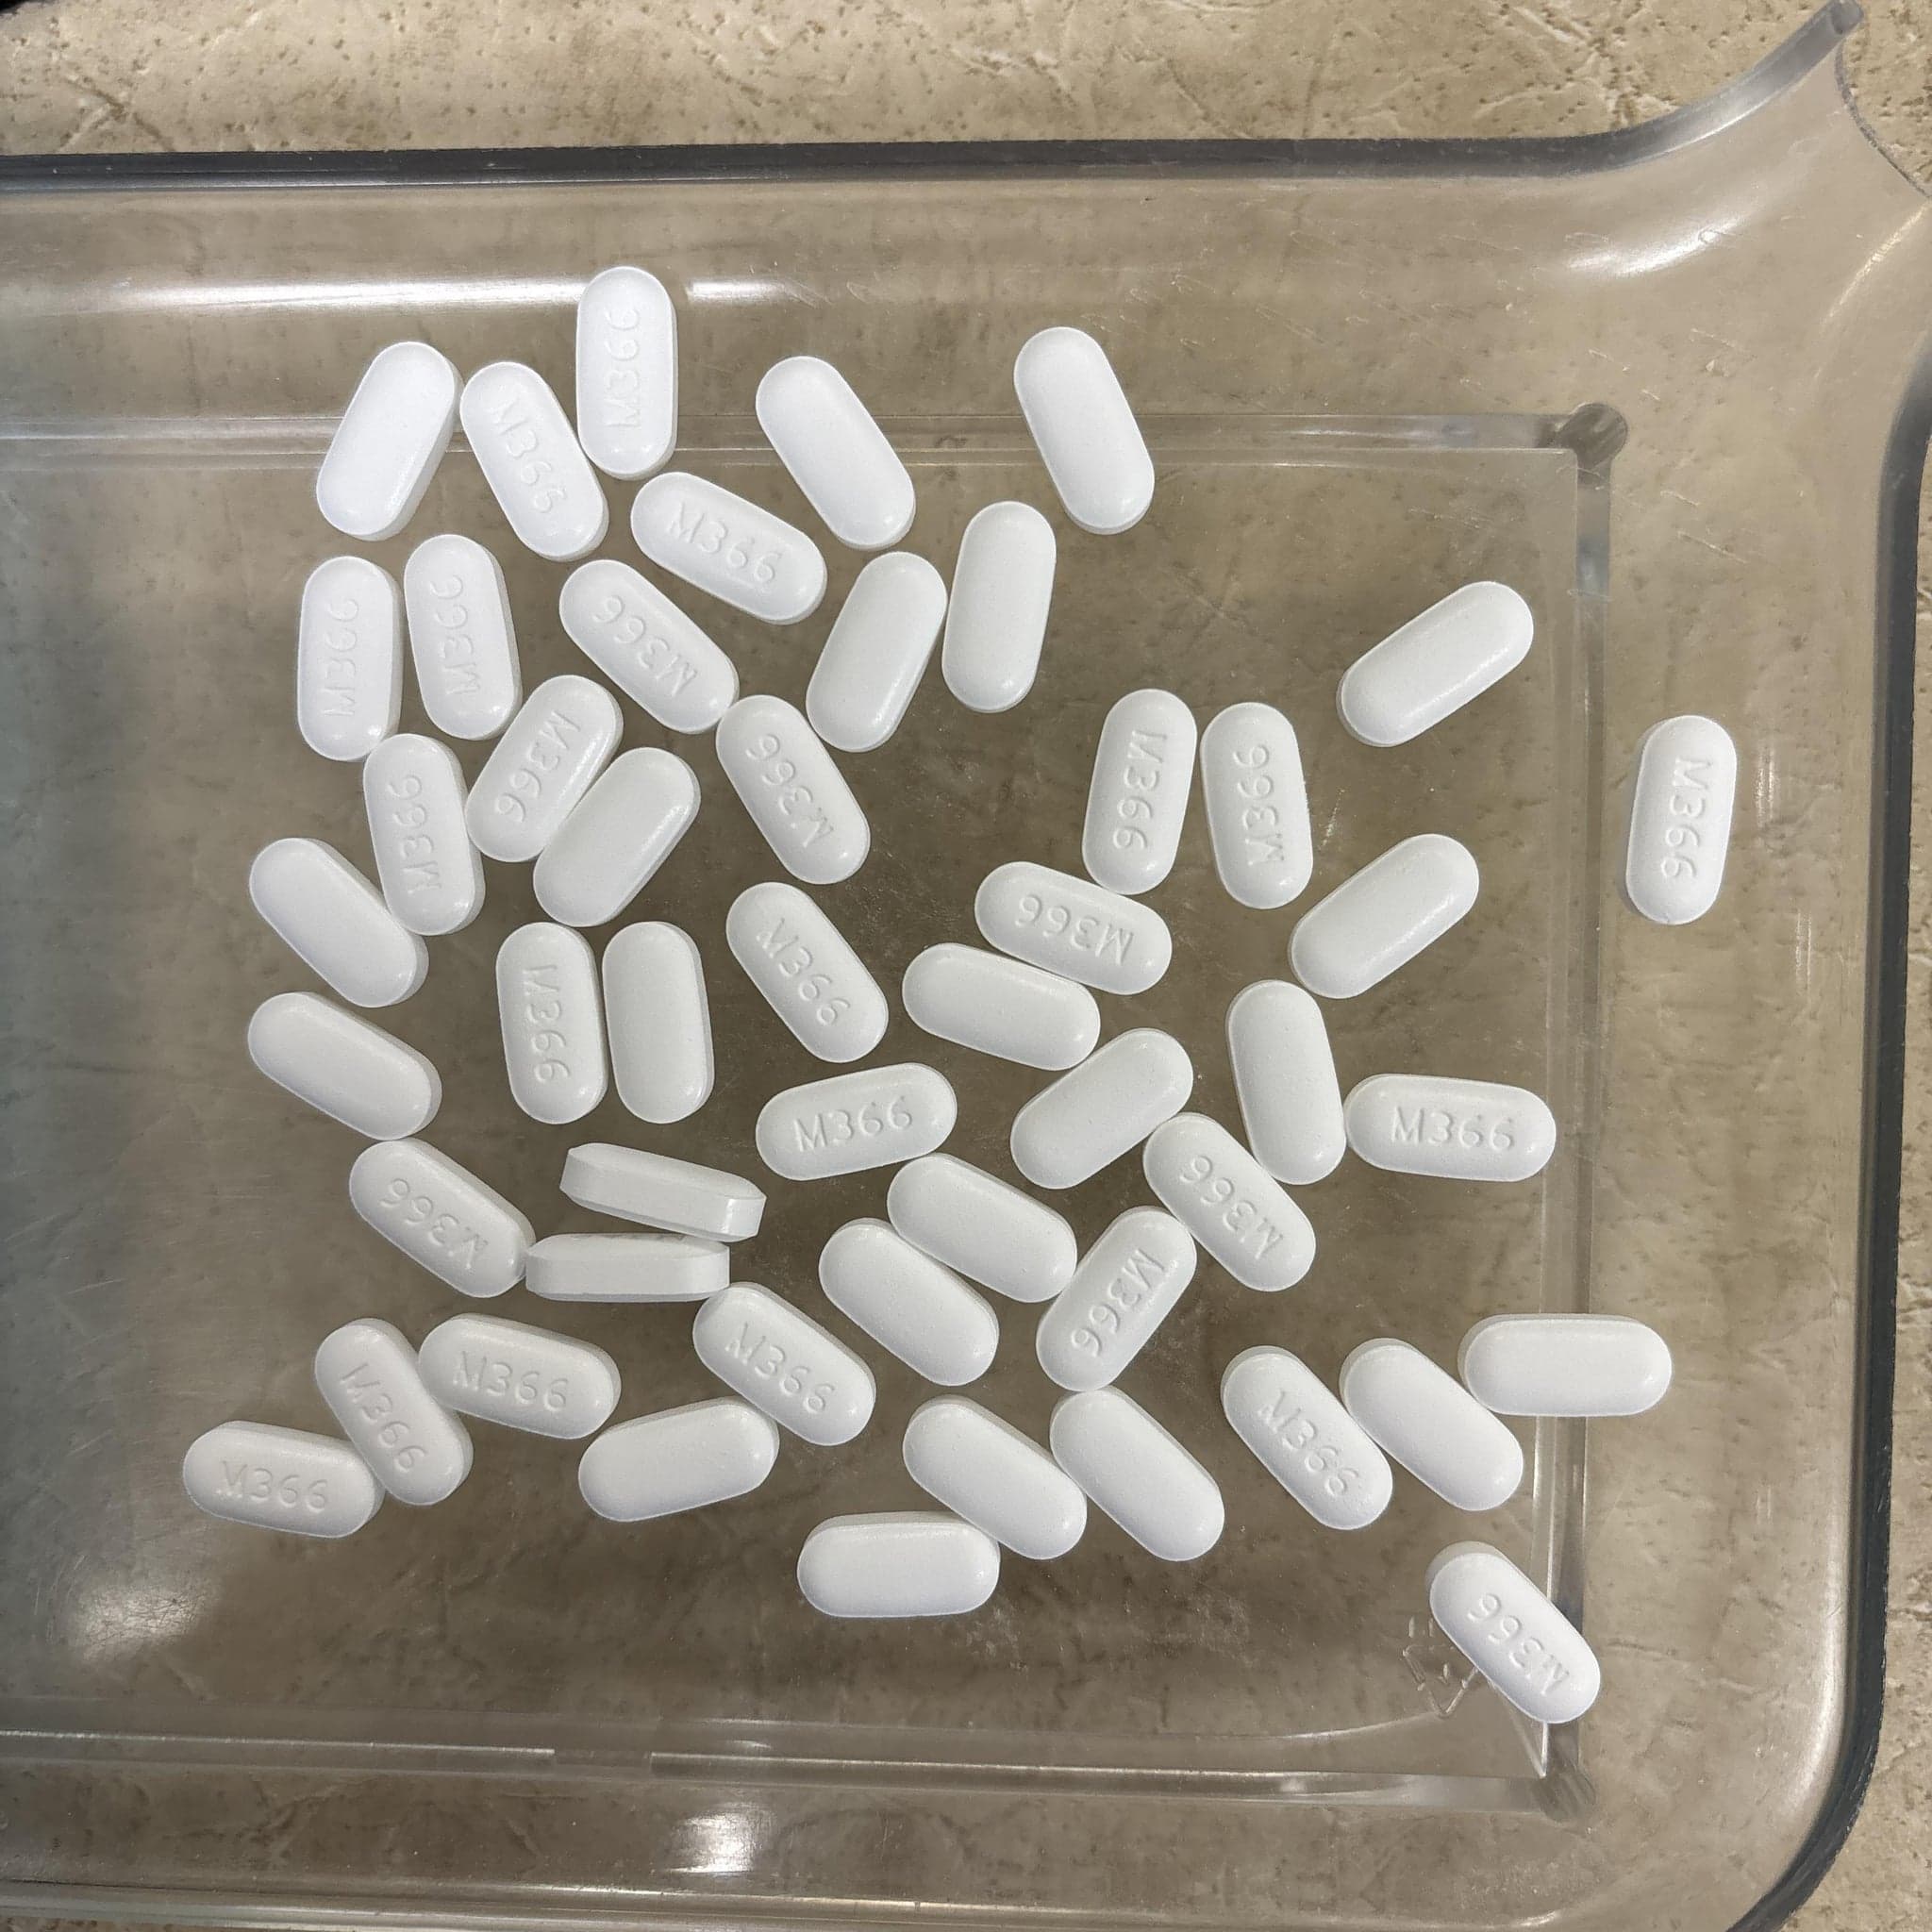
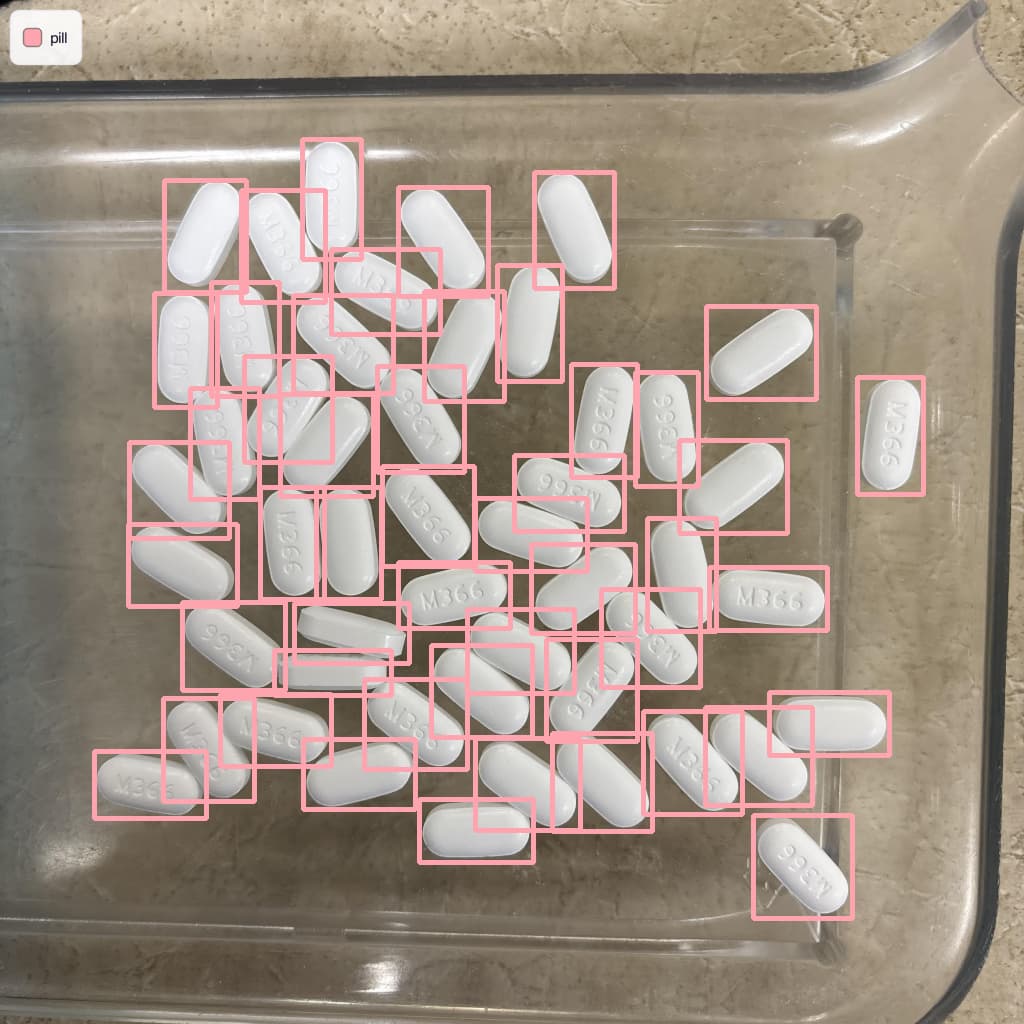
Detect all objects in this image. Output a JSON list where each entry contains the 2D bounding box in the key "box_2d" and the text label in the key "label". The "box_2d" value must be [y_min, x_min, y_max, x_max]: integers between 0 and 1000, normalized to the image height and width. Return only the JSON list, with no extra text. Only use these labels: pill
Ground truth
50 objects
How Object Detection is scored
Quality is scored by how well the predicted boxes overlap the ground truth, using mean Average Precision. The headline metric is mAP@50 (a prediction counts when its box overlaps the truth by at least 50%), with stricter mAP@75 and mAP@50:95 also reported.
Every model runs the same sample set. Under the current protocol each task is run three times at each effort tier and the score is the mean over those runs, shown with its ± range in the table; models benchmarked before the protocol ran once per task and are being re-run under it. Token usage is measured from each provider’s API response, and cost per sample is that usage multiplied by the model’s published pricing. See the full methodology.
Frequently Asked Questions
Mean Average Precision measures how well predicted boxes match ground-truth boxes. The number is the overlap (IoU) threshold a prediction must clear to count: mAP@50 requires 50% overlap, mAP@75 requires 75%, and mAP@50:95 averages across thresholds from 50% to 95%. Higher thresholds demand more precise boxes, so scores drop as the threshold rises.
These are general-purpose vision language models prompted to output boxes, with no task-specific training. Dedicated detectors trained on a specific dataset still score far higher on it. The value here is zero-shot flexibility: the same model can detect arbitrary classes described in plain text.
Every task is run at two levels of reasoning effort. The low row is the model answering with minimal deliberation, the high row is the same model on the same questions allowed to think longer. Both rows are ranked together so you can see whether the extra thinking is worth its cost and latency, which the Est. cost and Speed columns show, and the effort filter above the table shows one tier at a time. Models benchmarked before the current protocol have a high-effort row for Reasoning only until they are re-run. Every other table on this site, including the overall Average, uses the low-effort pass so all models are compared on the same amount of compute.
Under the current protocol each task is run three times at each effort tier, and the score shown is the mean over those runs. The ± is half the range between the lowest and highest run, so it shows how much the score moved between runs; it is a range, not a confidence interval. Hover the ± for the run count and range. A score without one comes from a single run; models benchmarked before the protocol are being re-run under it. OCR results are currently a single preliminary run per model, so they carry no ±.
Most models in this leaderboard link to their Playground page. Click the model name to open it, then upload your own image and run it. A few models are benchmarked for comparison only and do not have a Playground page yet.